BuySellBeep Daily- Tuesday, September 29, 2026
BuySellBeep Daily
Tuesday, September 29, 2026
NQ Tests Support as Gold, Semiconductors and High-Beta ETFs Come Under Pressure
Markets head into Tuesday with several major risk assets sitting at important technical levels. Nasdaq futures are trading below the daily pivot but remain above the BuySellBeep 4-hour demand zone, while the S&P 500 and Russell 2000 are also testing support.
Gold suffered a substantial technical breakdown, and leveraged products including GDXU, SOXL, FNGU and CONL all finished under pressure.
Tuesday also brings JOLTS Job Openings at 10:00 AM ET, followed later by important Chinese manufacturing data.
📍 Daily Levels for September 29, 2026
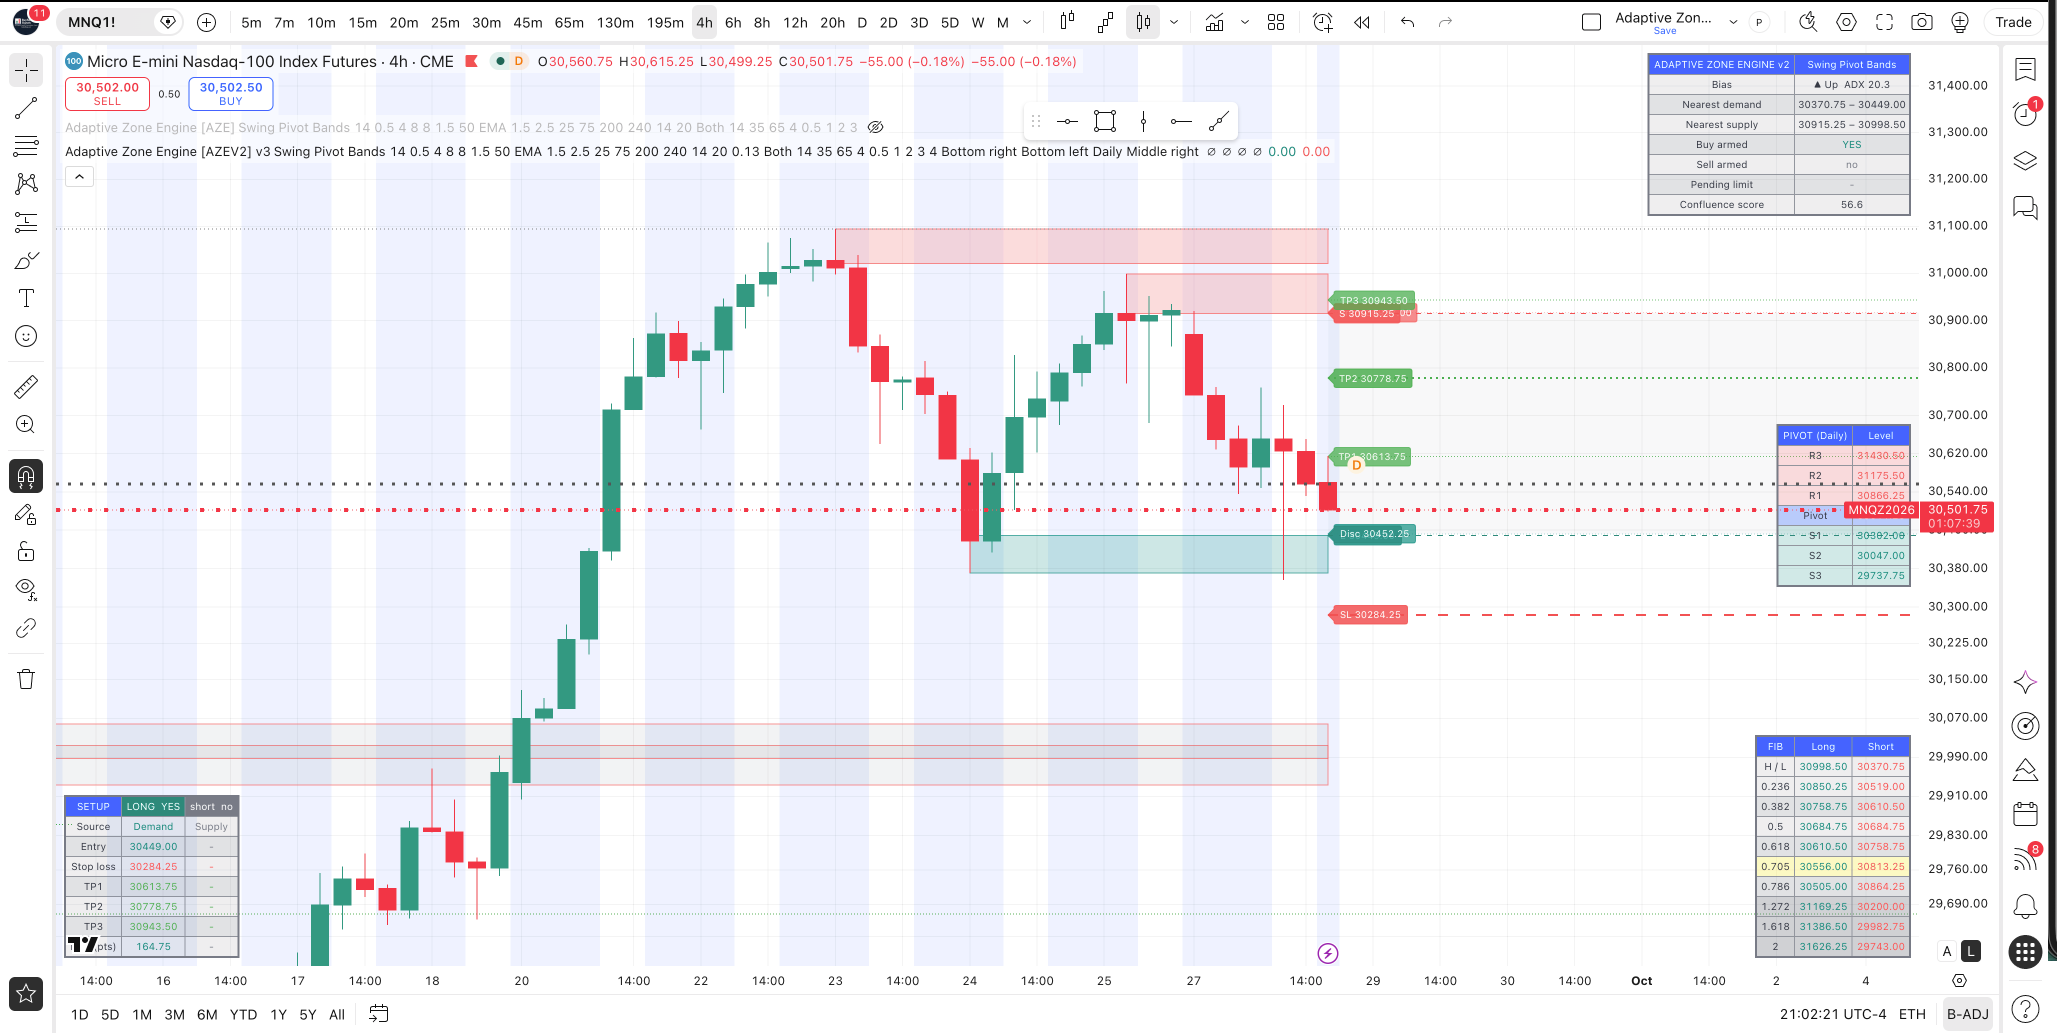
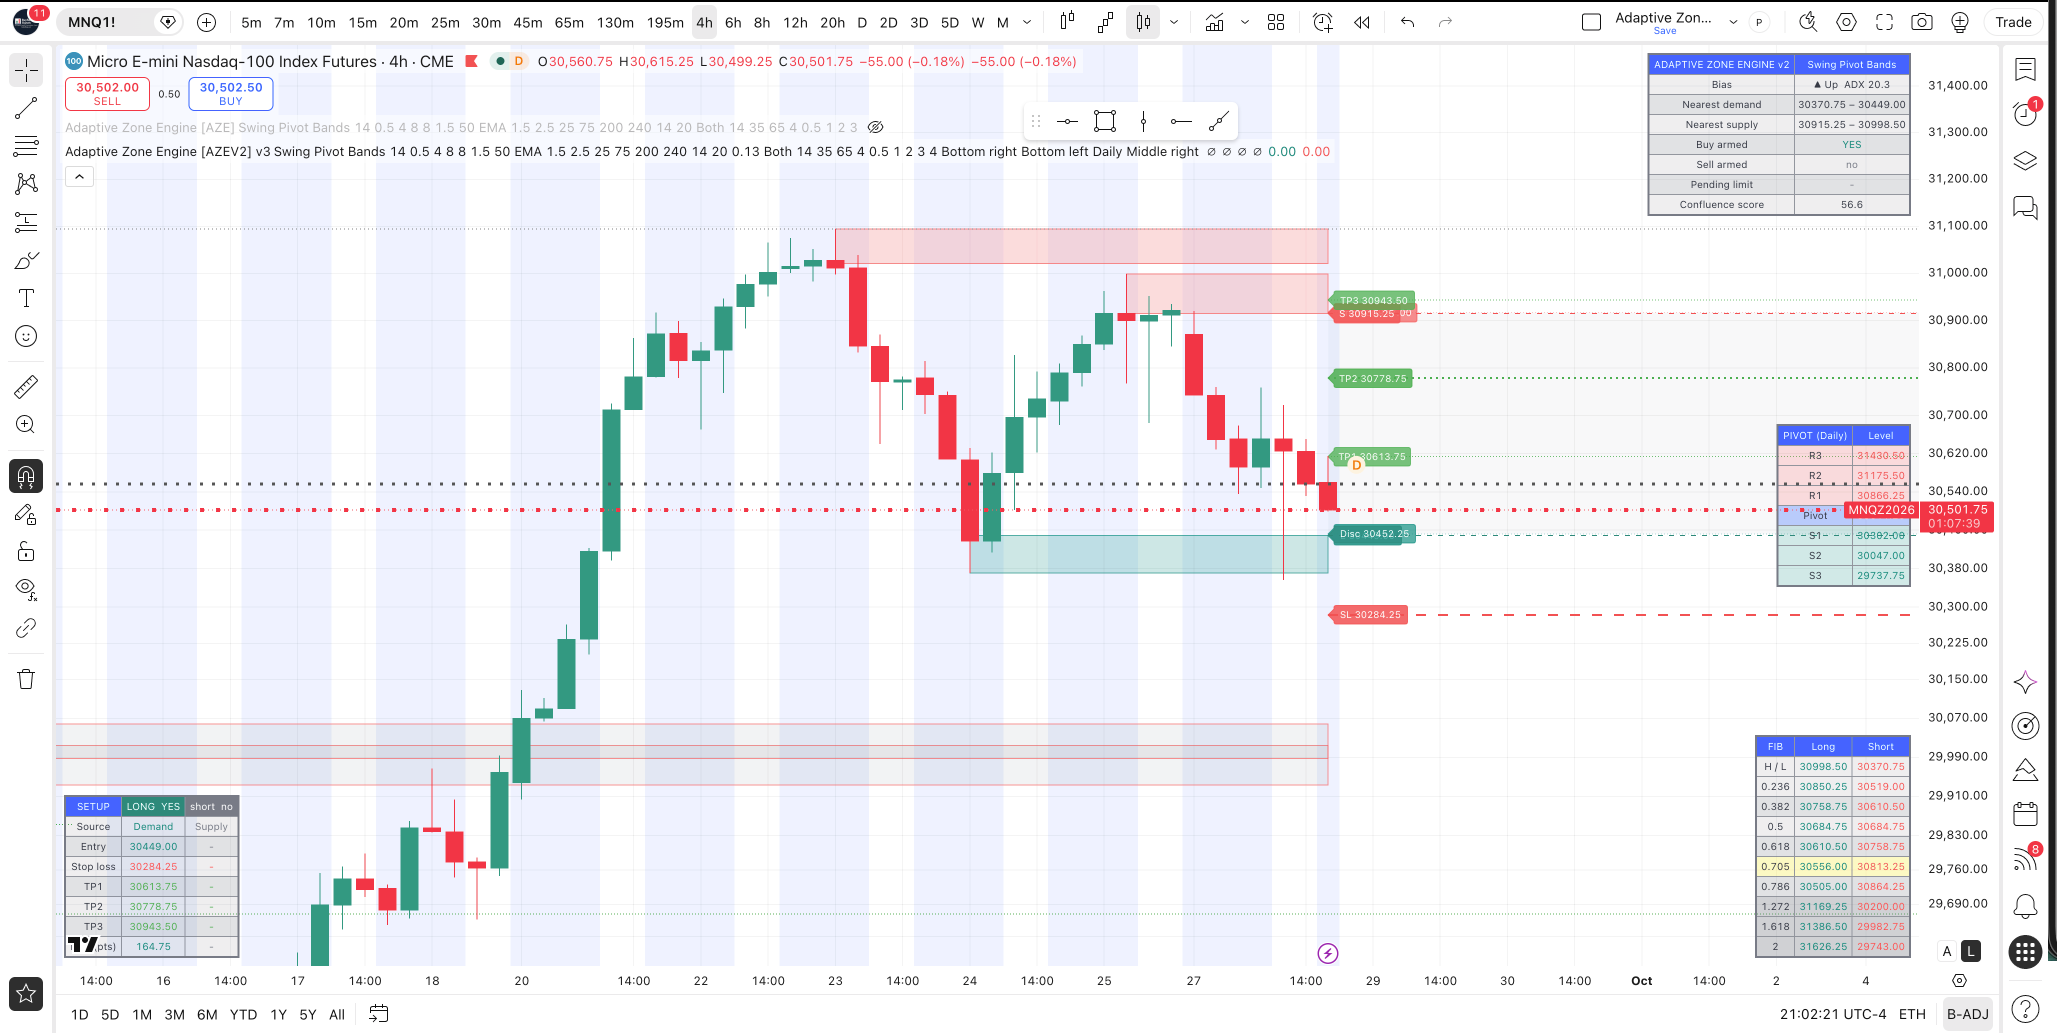
Nasdaq-100 — MNQ
Current: 30,551.25
BuySellBeep Bias: ↑ Up
Buy Signal: Armed
Confluence Score: 58.9
LevelPriceR331,430.50R231,175.50R130,866.25Pivot30,611.25S130,302.00S230,047.00S329,737.75
Nearest Demand: 30,370.75–30,449.00
Nearest Supply: 30,915.25–30,998.50
NQ enters Tuesday just beneath the 30,611 pivot, with the BuySellBeep 4-hour system still showing an upward bias.
The first major area underneath is 30,370.75–30,449. Holding that zone would preserve the possibility of another rotation toward the pivot and eventually 30,866.
If buyers reclaim 30,611, the next major upside test is 30,866 followed by the 30,915–30,998 supply zone.
A sustained loss of demand would shift attention toward 30,302 and then 30,047.
The question Tuesday: can buyers defend the 30,400 area?
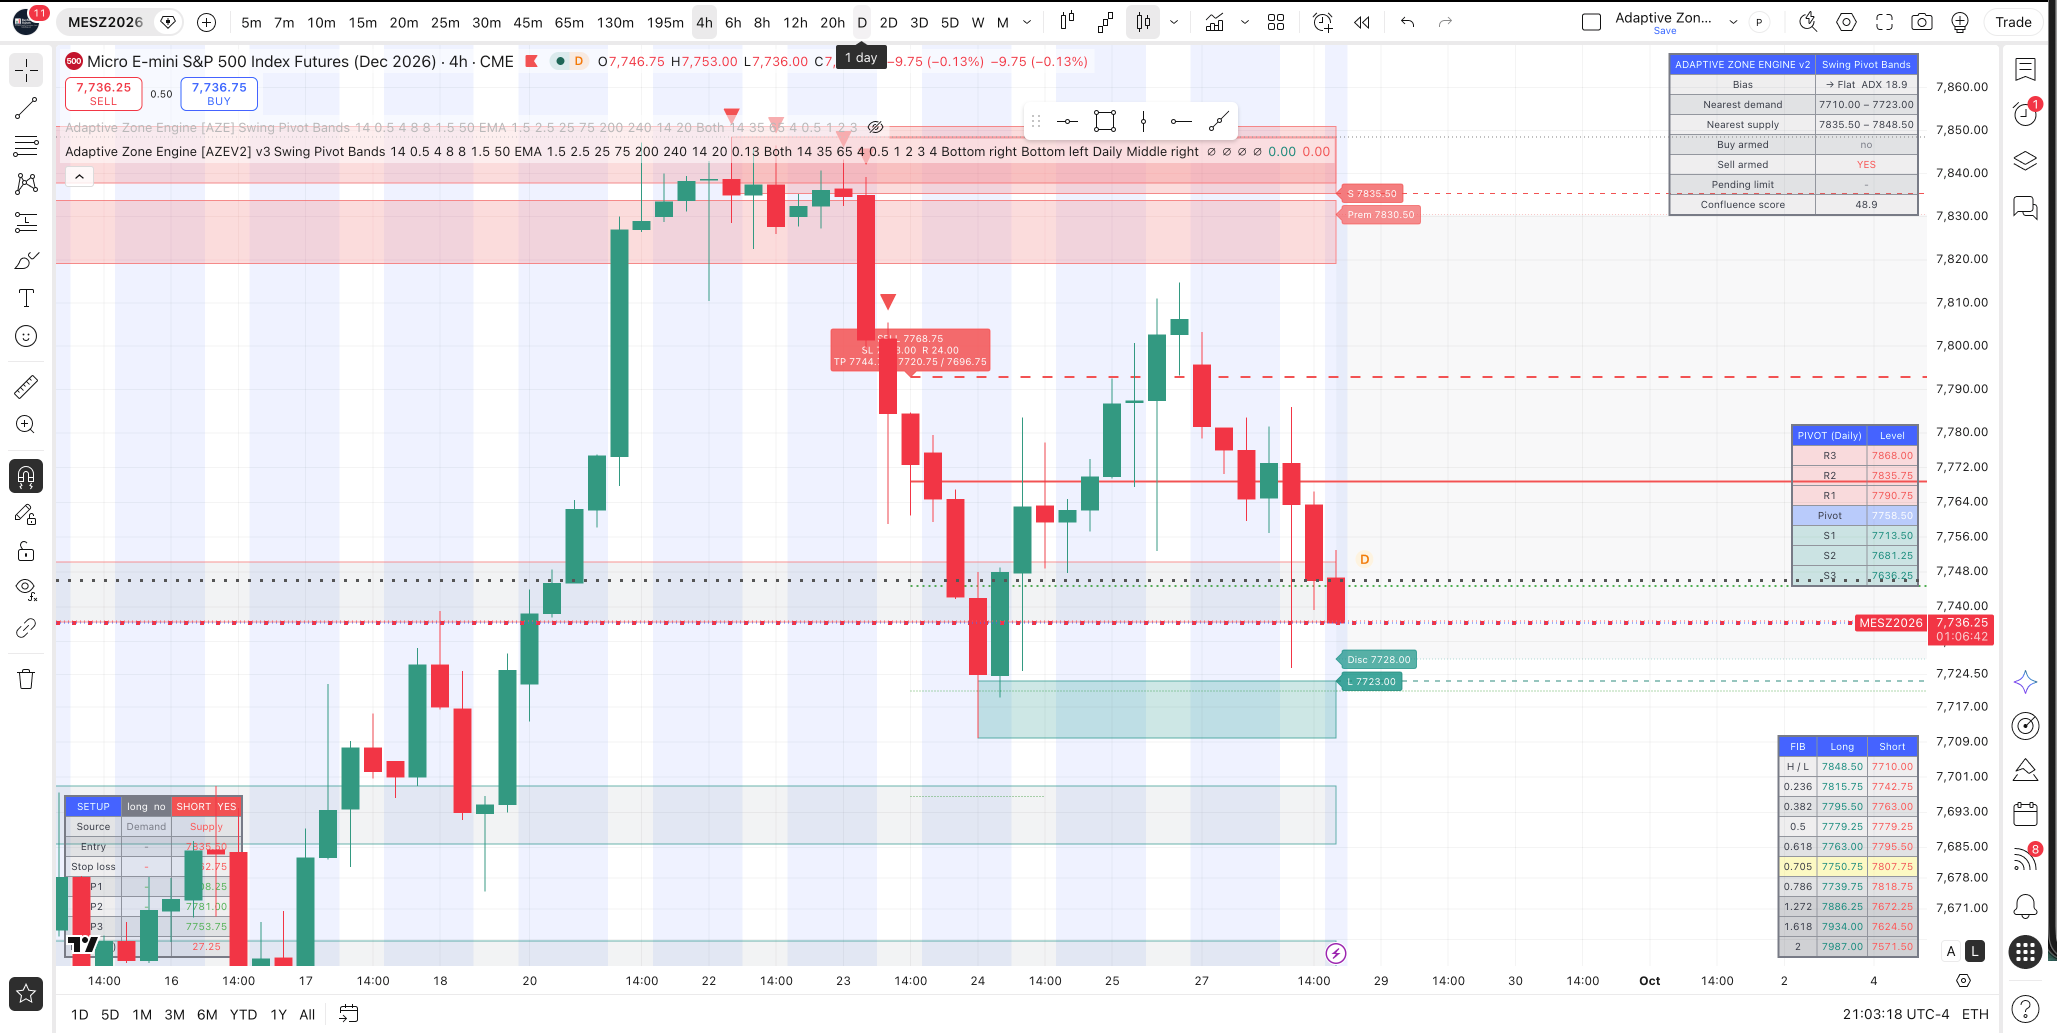
S&P 500 — MES
Current: 7,740.75
Bias: Flat
Sell Signal: Armed
LevelPriceR37,868.00R27,835.75R17,790.75Pivot7,758.50S17,713.50S27,681.25S37,636.25
Nearest Demand: approximately 7,710–7,723
Nearest Supply: 7,835.50–7,848.50
MES finished below its 7,758.50 pivot, leaving the market between the pivot and first support.
The 7,710–7,723 area is the key lower zone. A recovery above the pivot would put 7,790.75 back in play, while a break through demand could expose 7,681.
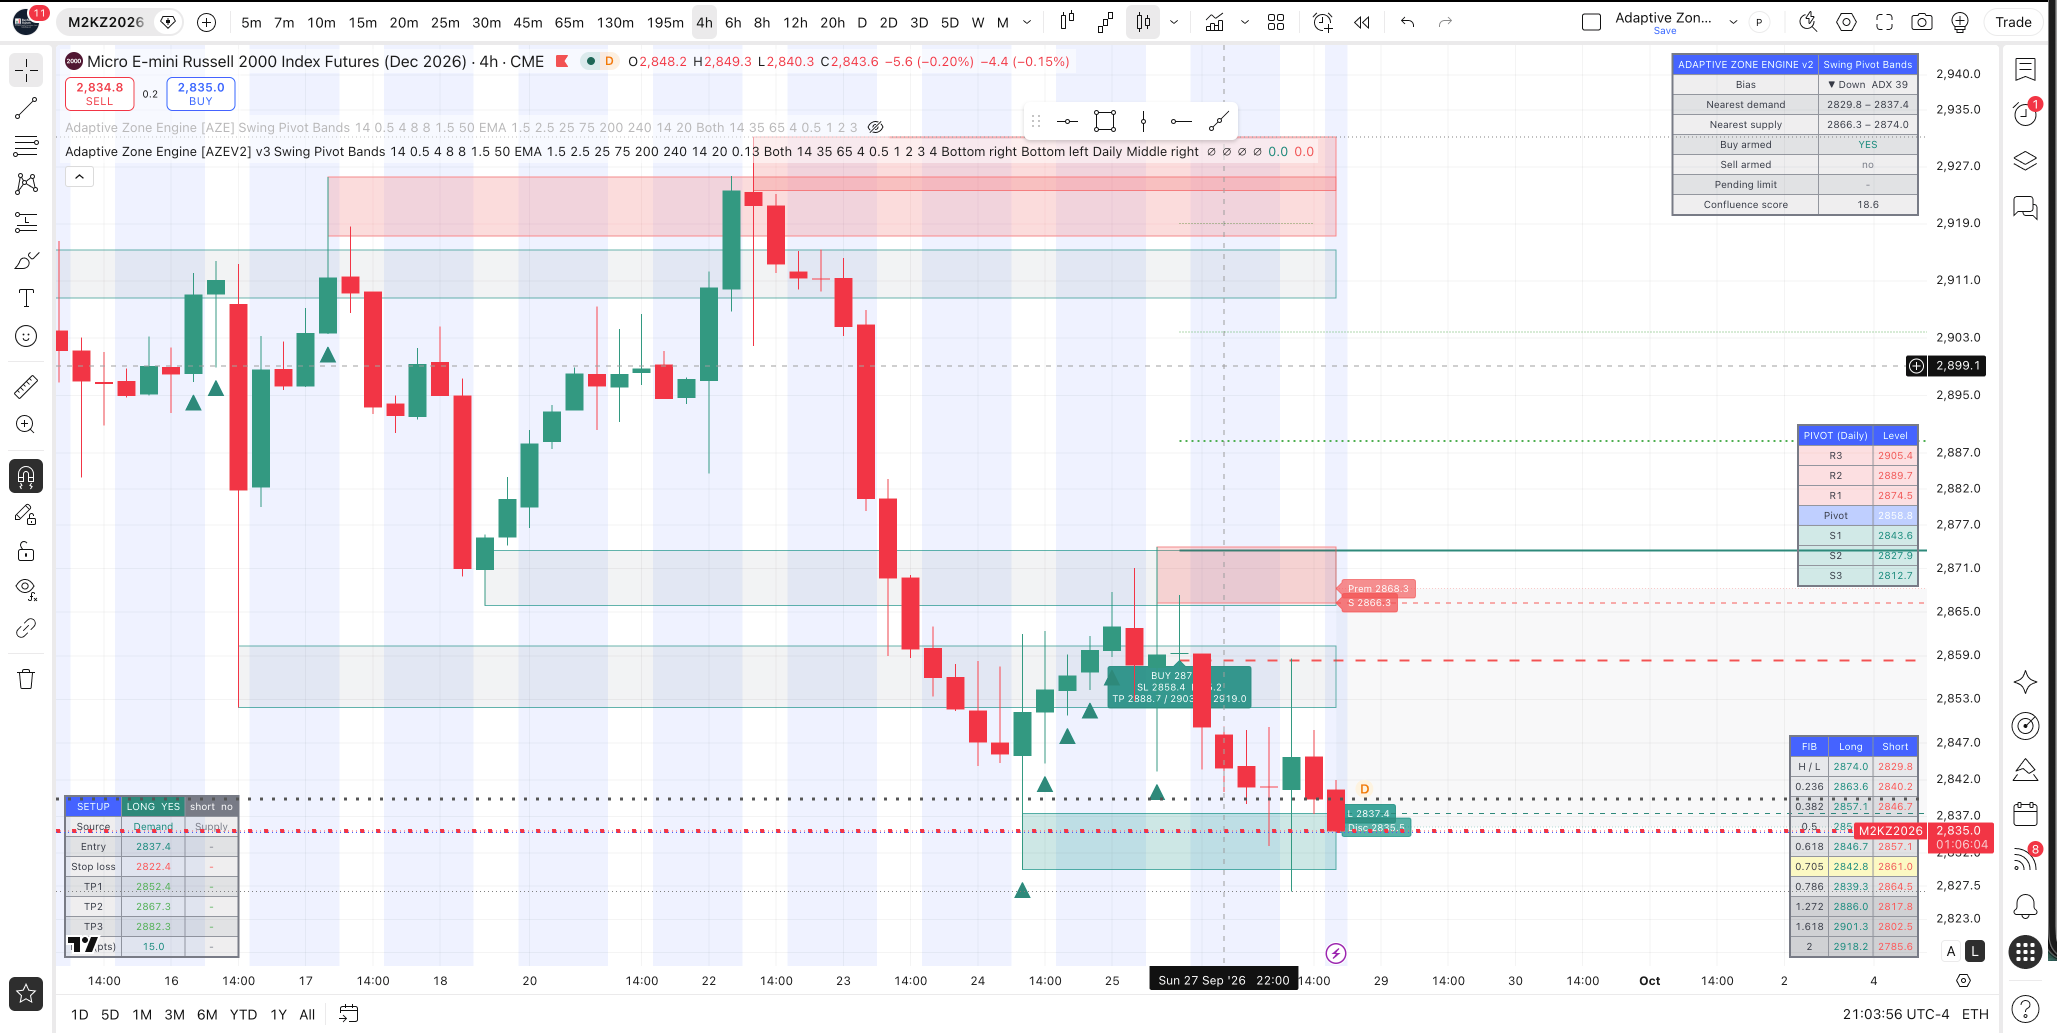
Russell 2000 — M2K
Current: 2,837.1
4-Hour Bias: ↓ Down
Buy Signal: Armed
LevelPriceR32,905.4R22,889.7R12,874.5Pivot2,858.8S12,843.6S22,827.9S32,812.7
Nearest Demand: 2,829.8–2,837.4
Nearest Supply: 2,866.3–2,874.0
Russell futures are essentially sitting inside BuySellBeep demand.
That makes M2K one of Tuesday’s cleaner decision points.
Price is below both S1 at 2,843.6 and the 2,858.8 pivot, but the system’s buy condition is armed around the current demand zone.
A successful defense could target 2,844 and then 2,859. Failure of 2,829 puts 2,812.7 into view.
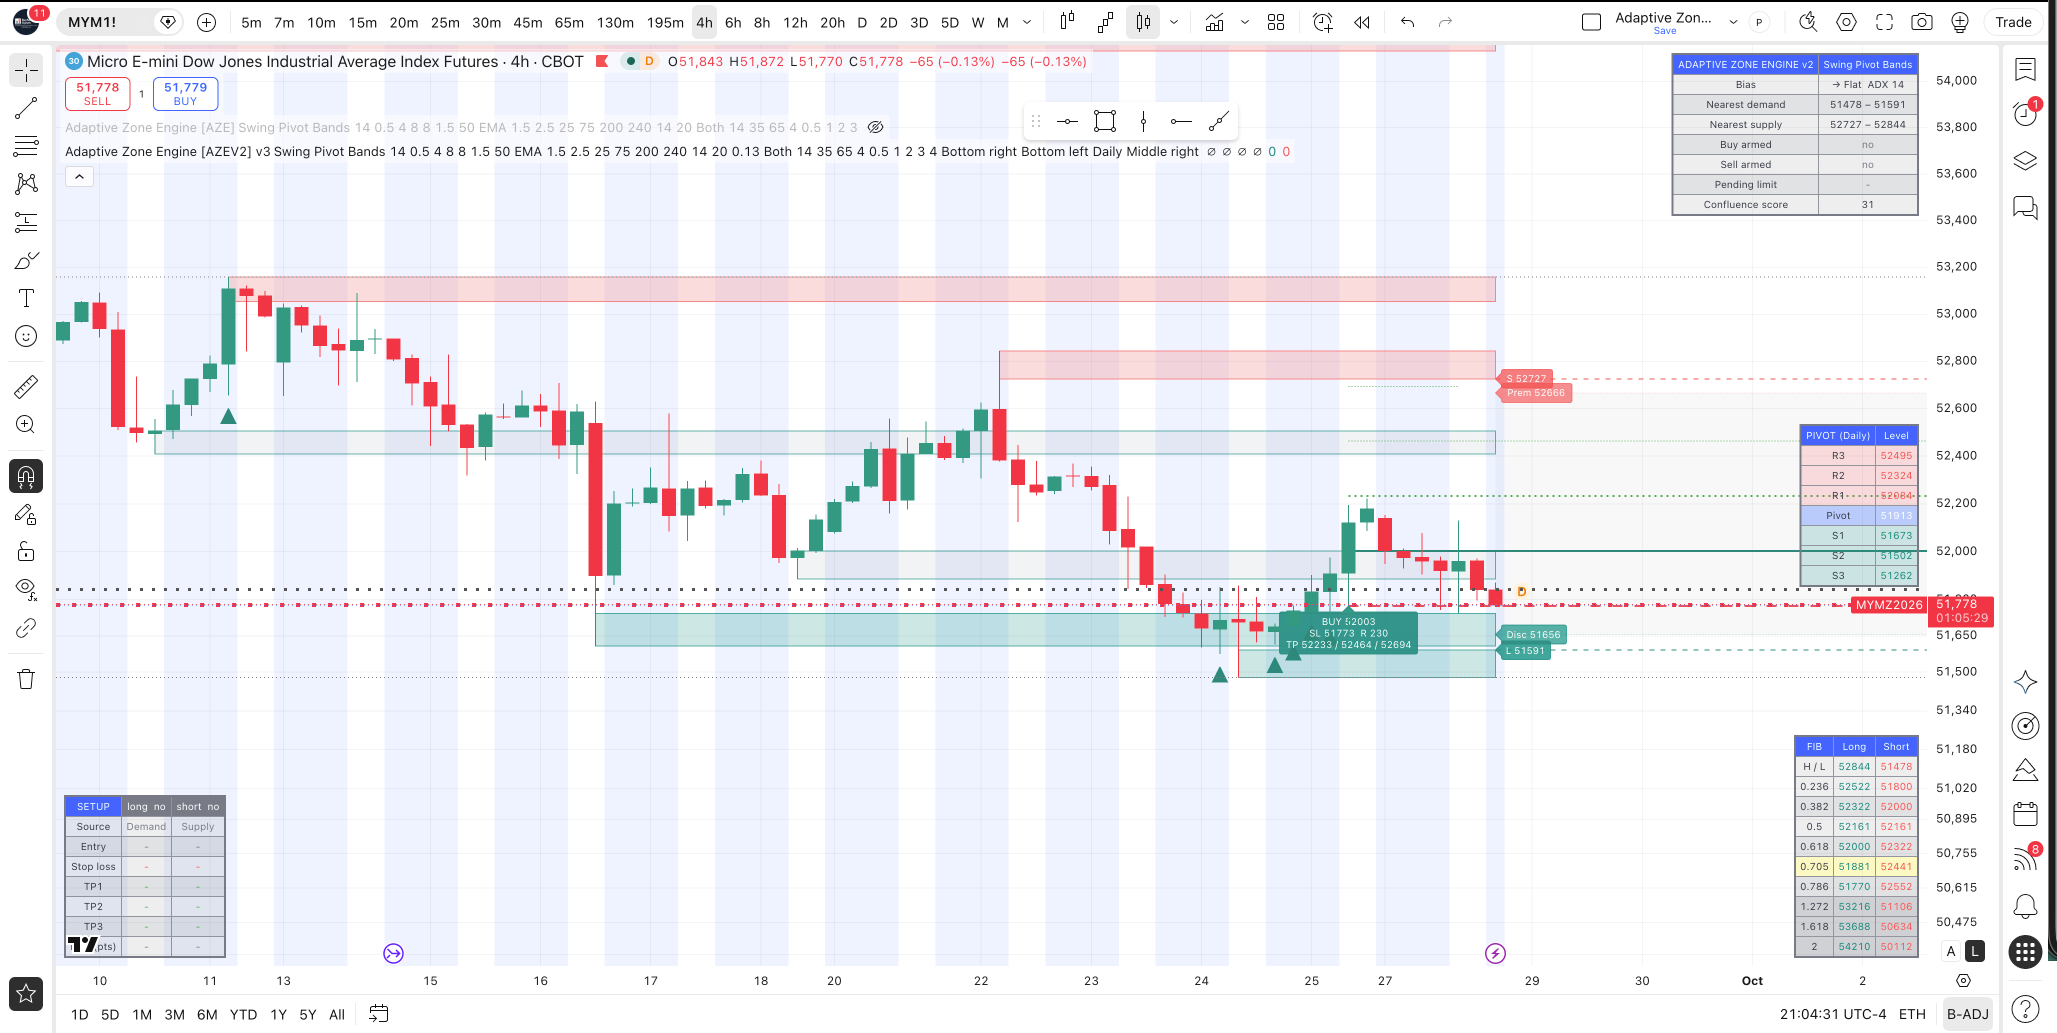
Dow — MYM
Current: 51,793
The BuySellBeep trend dashboard remains broadly defensive.
EMA 34: 52,016
EMA 89: 52,322
Primary Trend: Bearish
MACD: Bullish
RSI: Neutral at 40.76
SuperTrend: Bearish
McGinley: Bearish
VWAP: Price below
Composite Score: Moderate Bearish (-3/7)
The mixed reading is important. Momentum is attempting to stabilize, but price remains underneath several broader trend measures.
For Tuesday, the Dow needs to reclaim the 51,900–52,000 region before the short-term picture begins to improve materially.
Gold — MGC
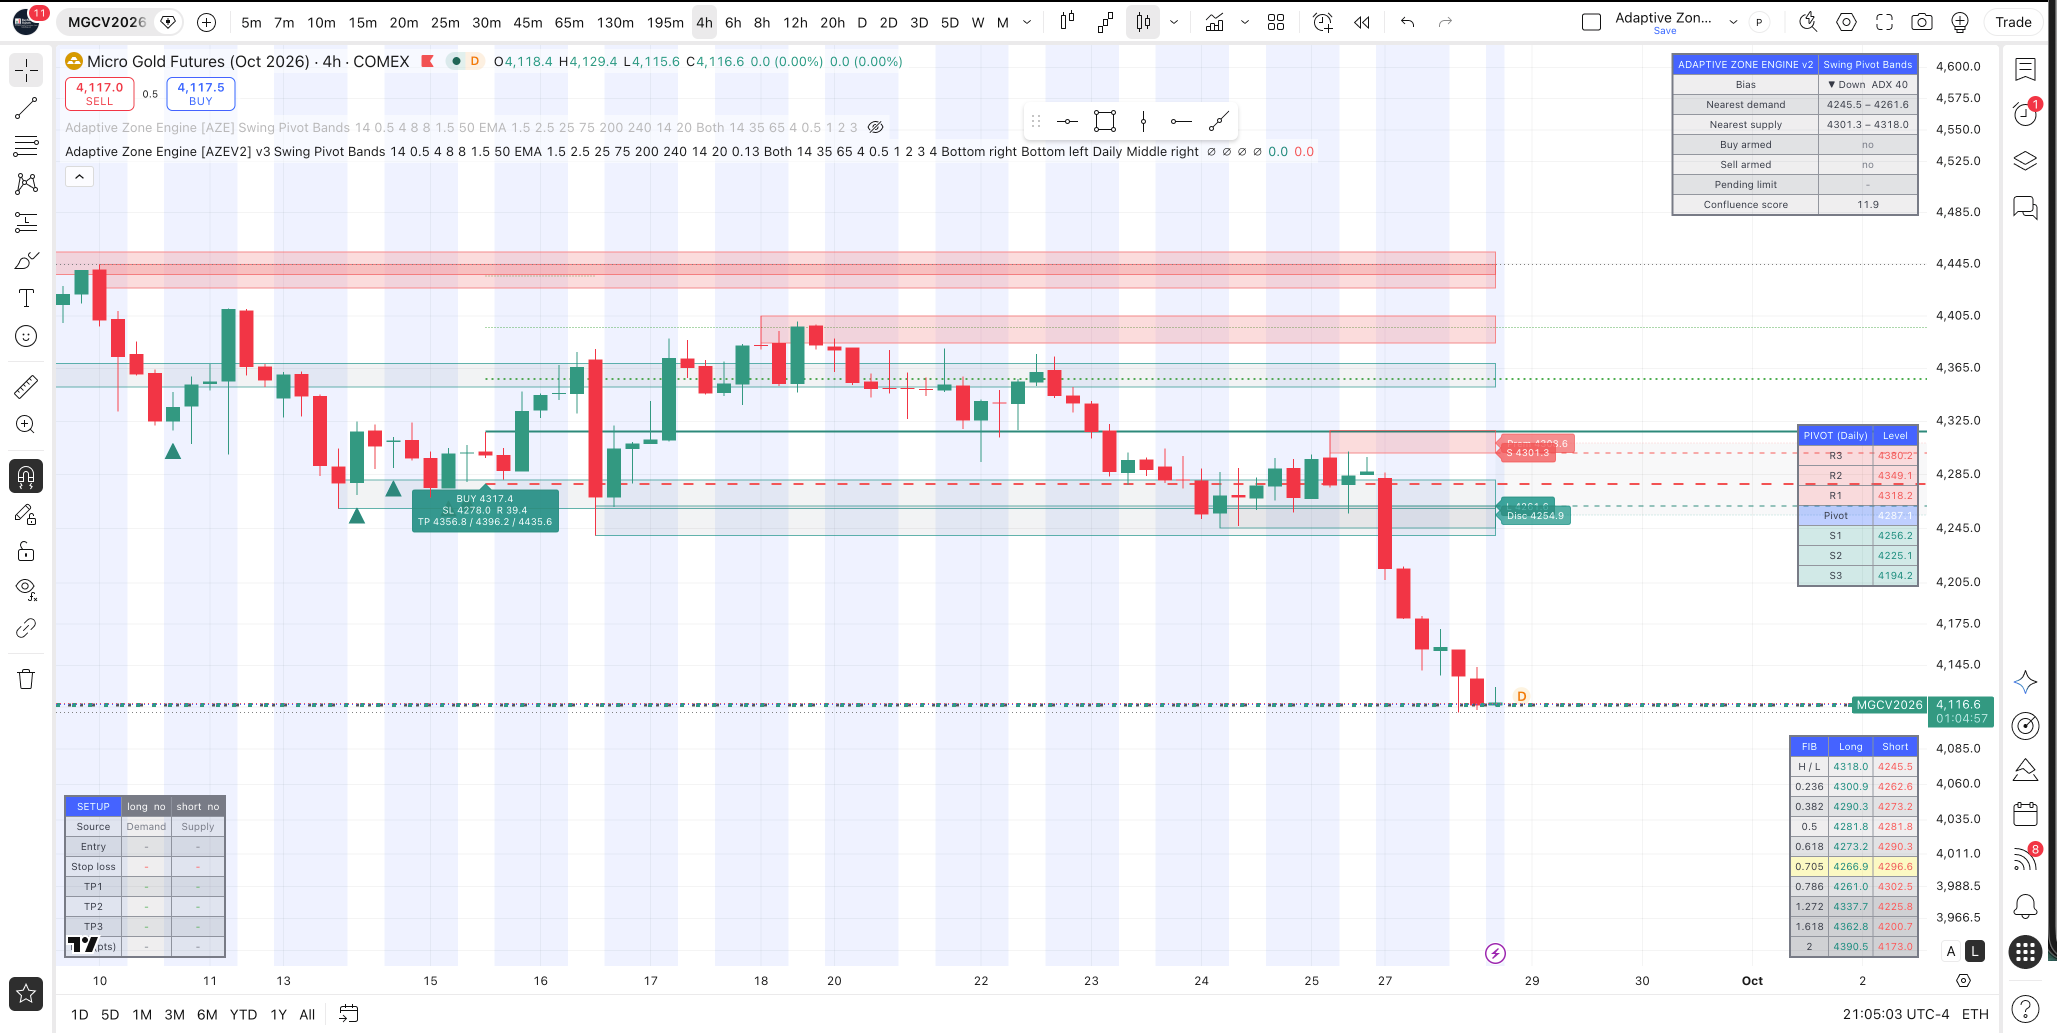
Major Breakdown in Gold
Current: 4,122.6
Bias: ↓ Down
ADX: 40
LevelPriceR34,380.2R24,349.1R14,318.2Pivot4,287.1S14,256.0S24,225.1S34,194.2
Gold has broken below all three daily support levels, including S3 at 4,194.2.
That is a materially different technical condition from simply trading below the pivot.
The market is stretched beneath its previous support structure, so Tuesday traders should watch for either a continuation lower or an attempt to reclaim 4,194–4,225.
The BuySellBeep dashboard remains Down with ADX near 40, indicating a comparatively strong directional trend on the displayed timeframe.
📊 BuySellBeep Algo — Daily Scorecard
What a $100,000 Account Would Represent
Today’s BuySellBeep paper-brokerage dashboard displays:
+1.99% Return
On a hypothetical $100,000 account, a 1.99% return mathematically equals:
+$1,990
Paper Brokerage DashboardDisplayed ResultReturn+1.99%$100K Equivalent+$1,990Net Profit+$6,423.20Fees-$136.80Unrealized+$3,994.40Equity$532,976.38Holdings$2,071,940.00
The +$1,990 figure is not the actual account profit shown above. It is simply a standardized illustration of what 1.99% represents on $100,000.
We use the same $100K benchmark each day so subscribers can compare the displayed percentage results on a consistent basis.
Paper, hypothetical and simulated trading results have important limitations. Results shown should not be interpreted as the performance a particular investor would necessarily achieve. Trading leveraged instruments involves substantial risk.
⚡ ETF EDGE
Four Leveraged Markets. One Quick Read.
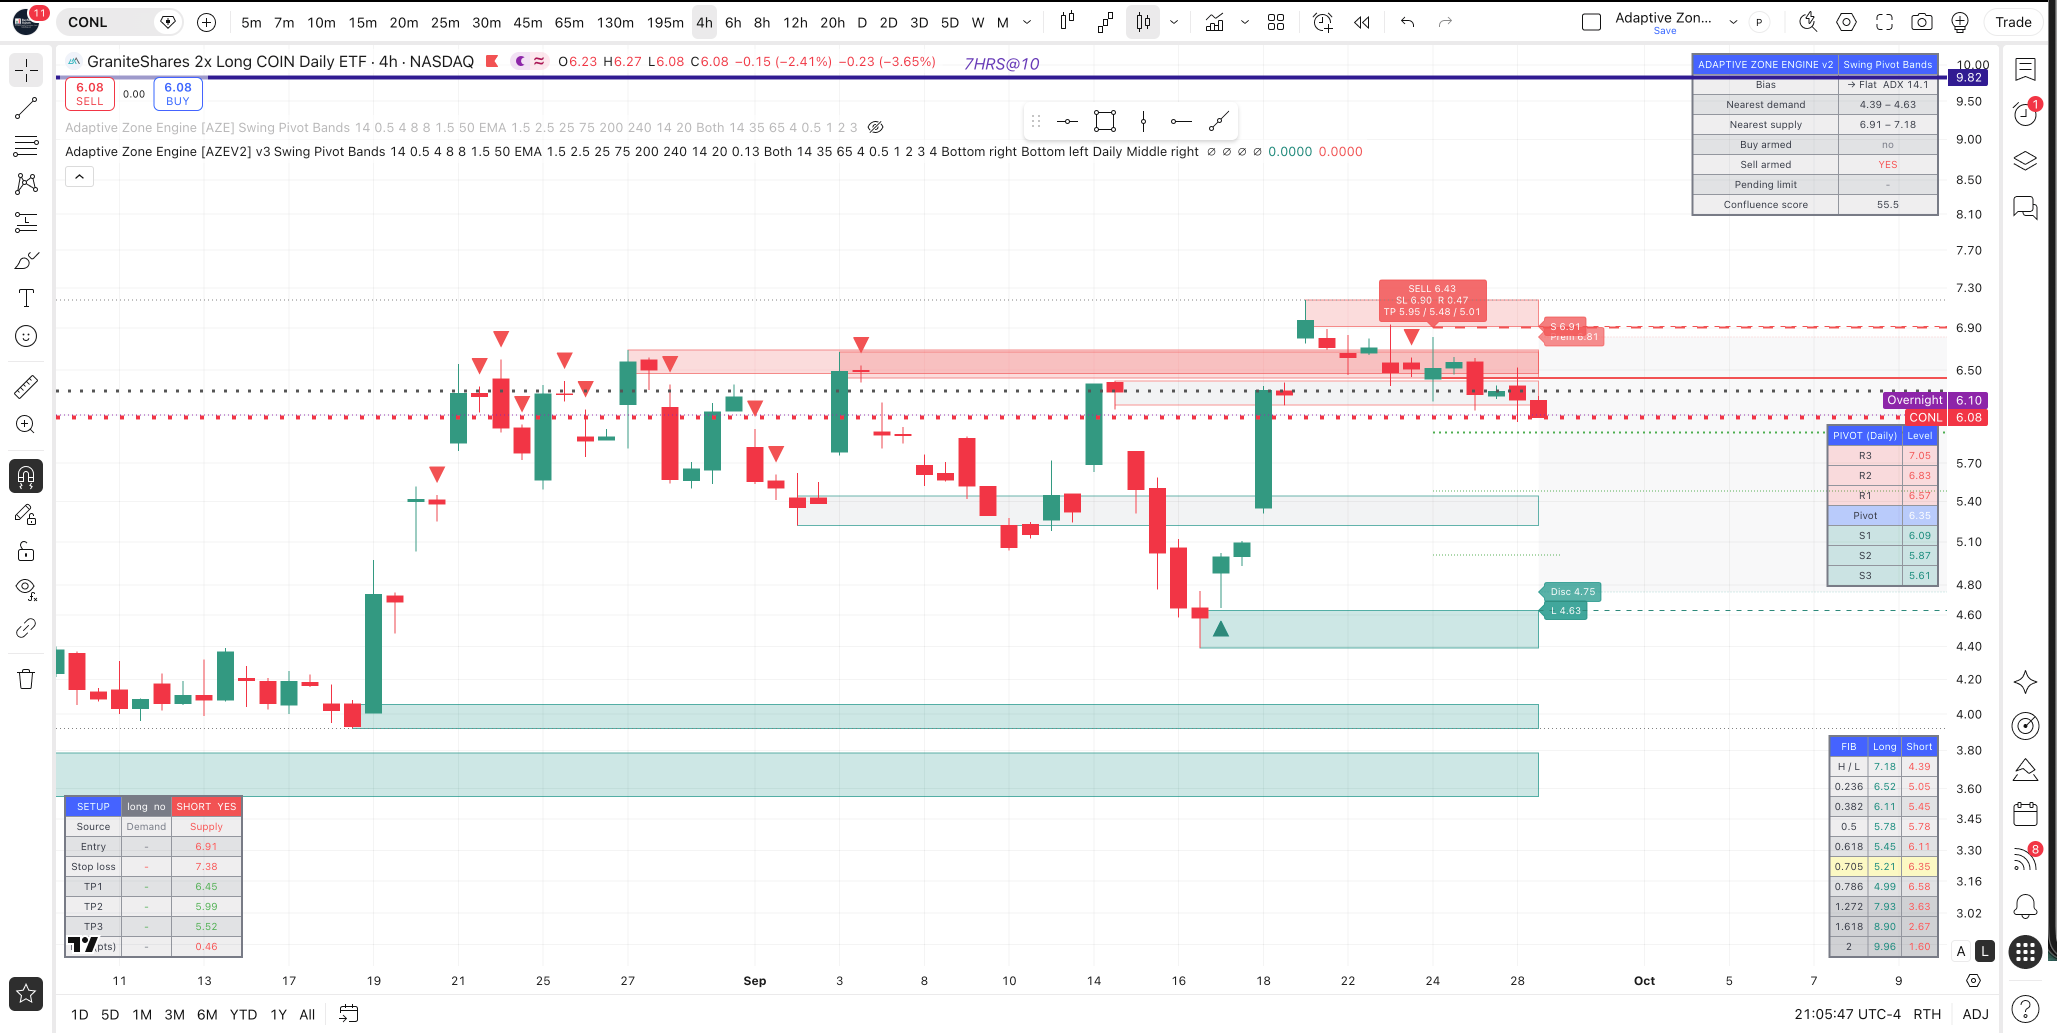
CONL — Coinbase 2x Long
Price: $6.08
Session Move Shown: -3.65%
BuySellBeep Bias: Flat
Sell Signal: Armed
Pivot: $6.35
S1: $6.09
S2: $5.87
S3: $5.61
Supply: $6.91–$7.18
CONL closed almost directly on S1 at $6.09.
The immediate battle is therefore simple: reclaim $6.09–$6.35, or risk opening the door toward $5.87.
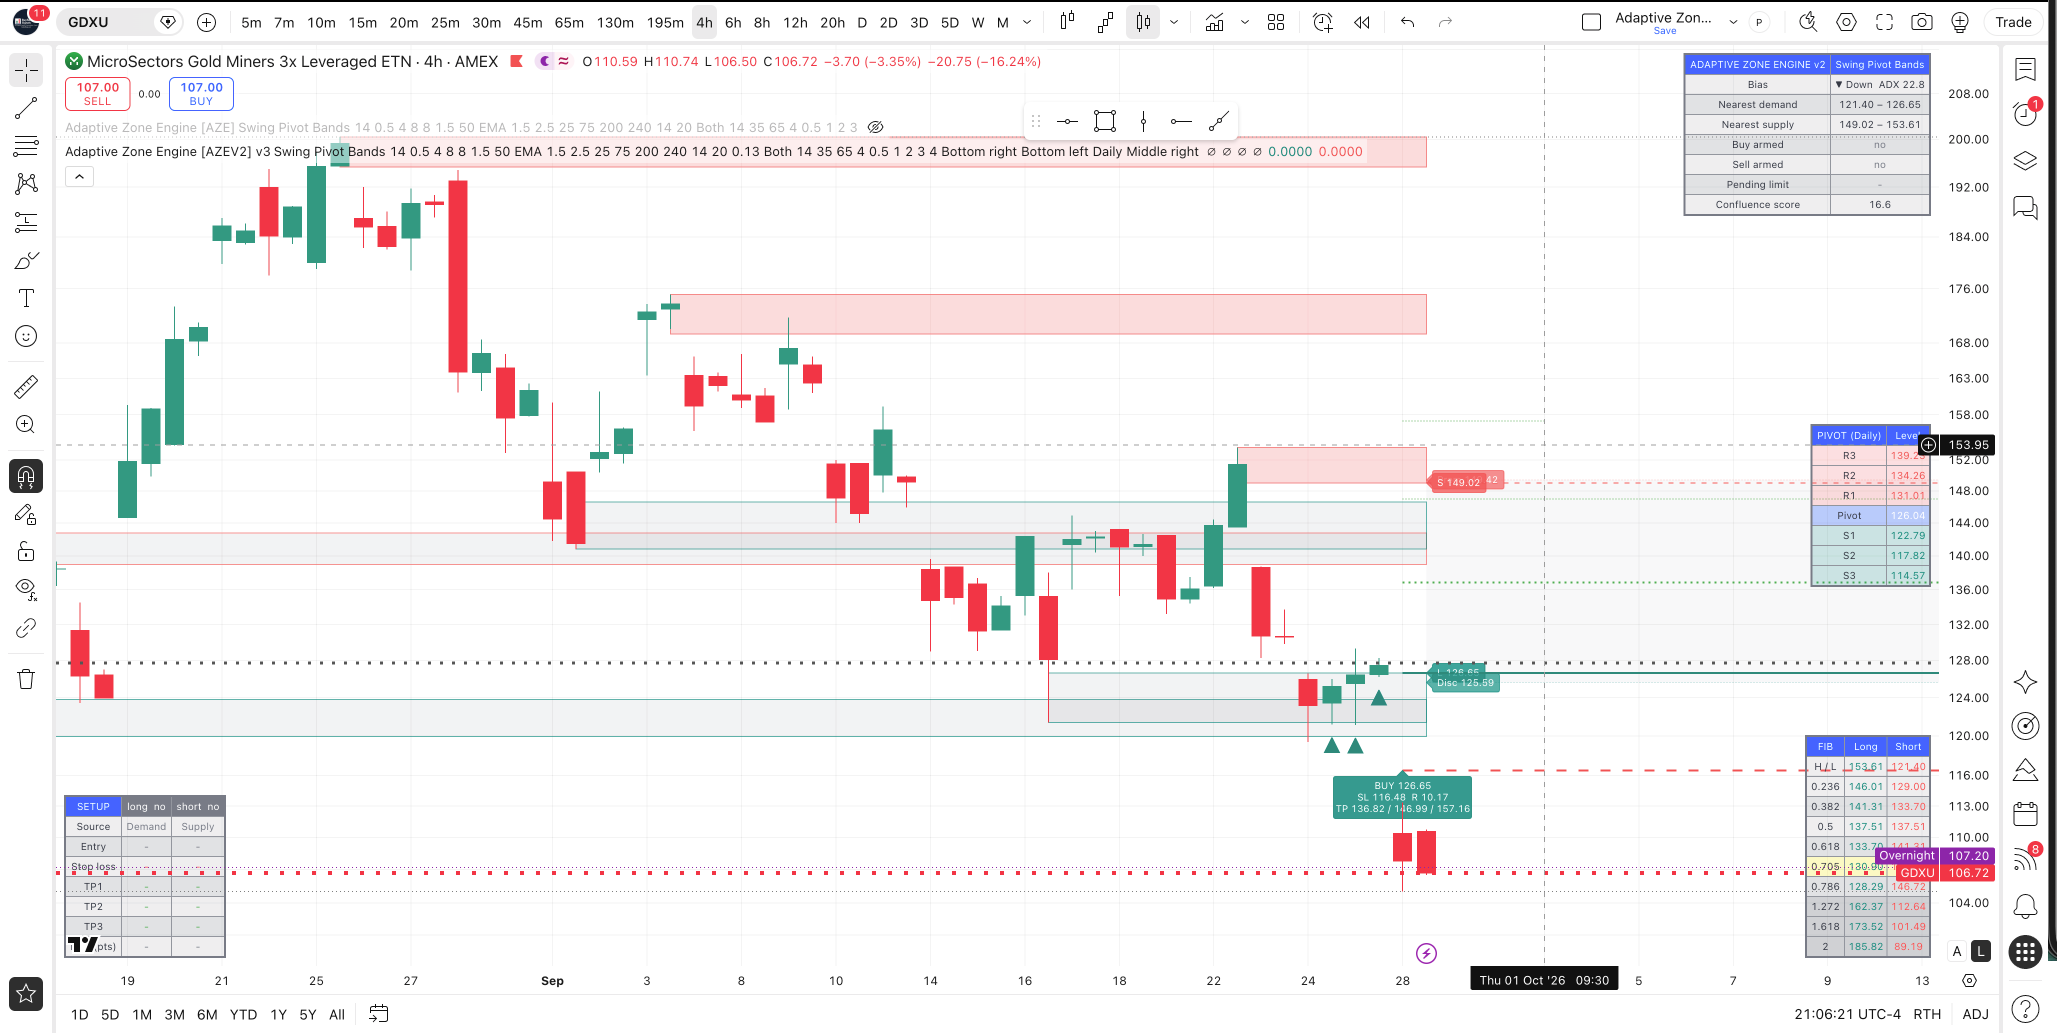
GDXU — Gold Miners 3x Leveraged
Price: $106.72
Session Move Shown: -16.24%
BuySellBeep Bias: ↓ Down
Pivot: $126.04
S1: $122.79
S2: $117.82
S3: $114.57
GDXU experienced the most dramatic move of today’s ETF Edge group.
At $106.72, price is already well beneath S3 at $114.57 following the selloff in gold and gold miners.
This is no longer a normal pivot test. It is a breakdown below the established daily support structure.
That can create powerful moves in either direction because GDXU provides leveraged daily exposure.
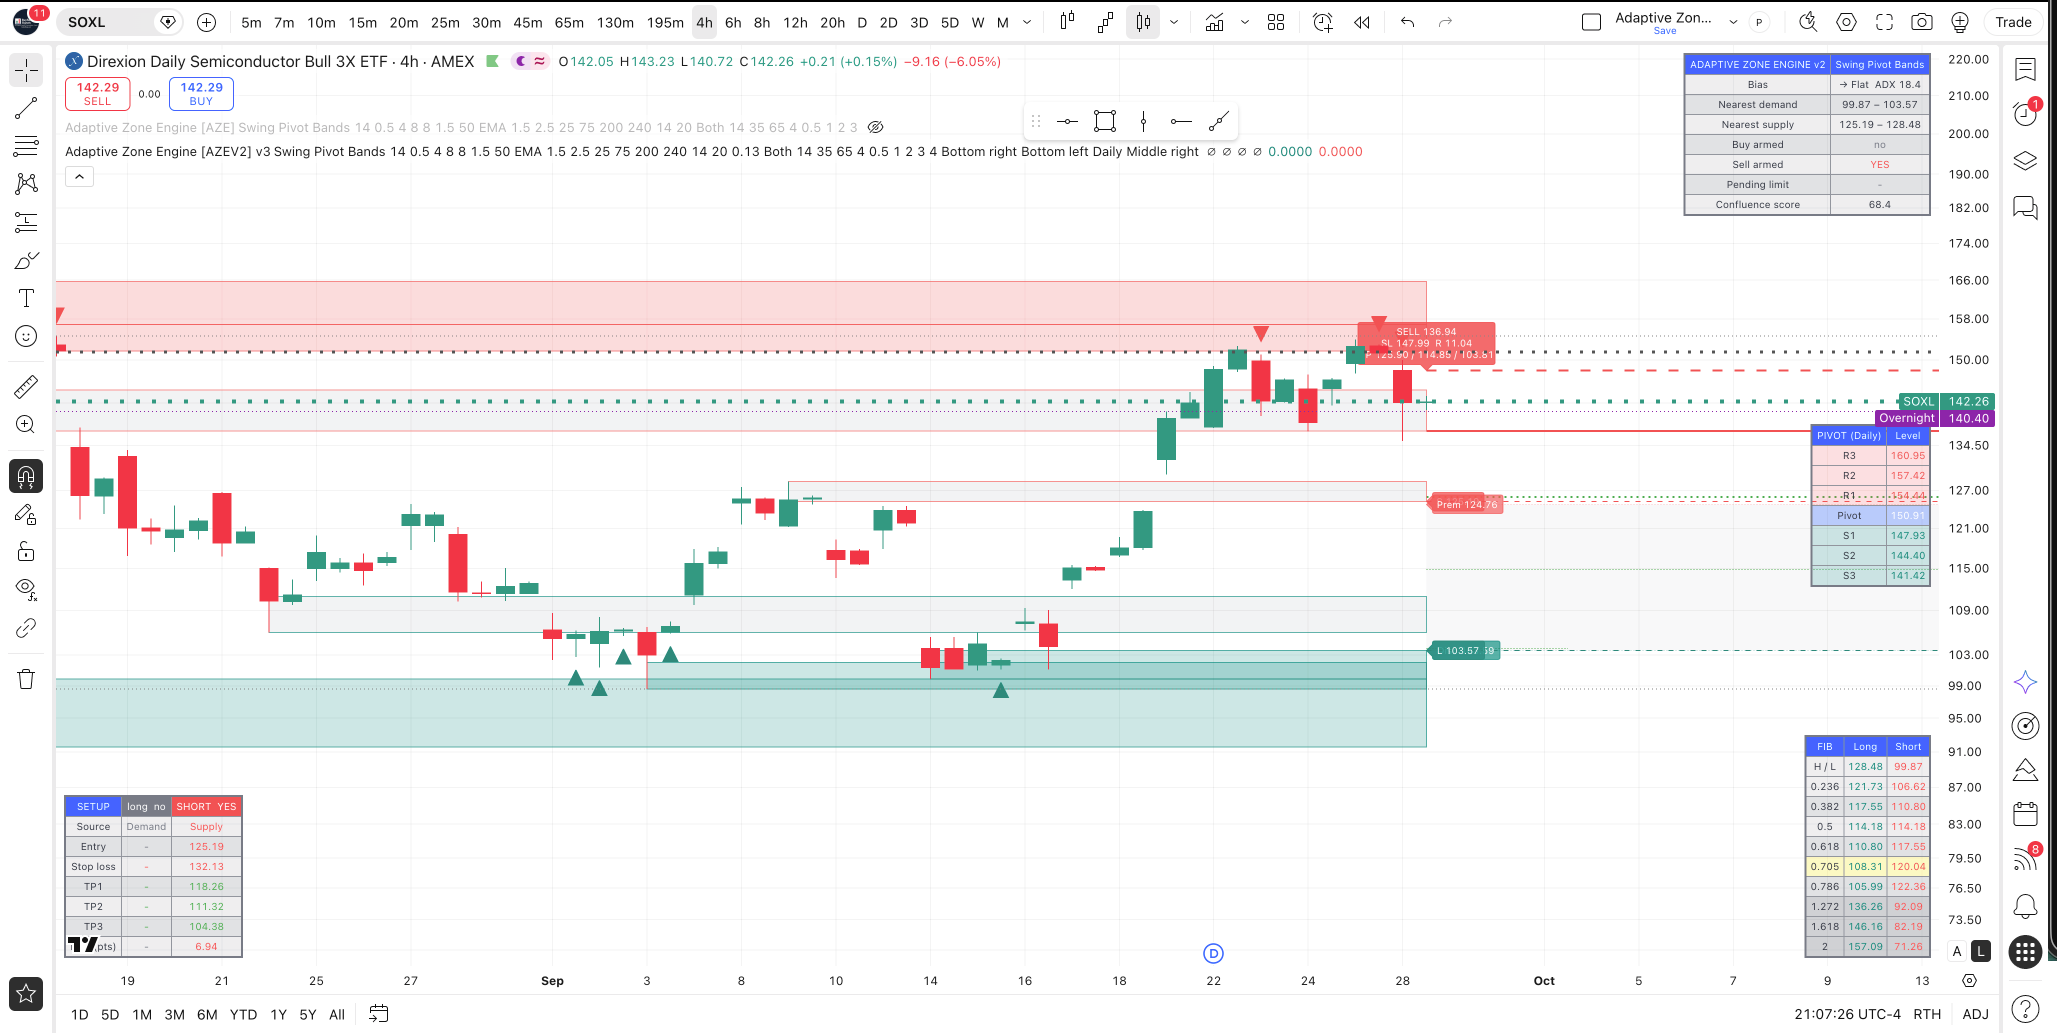
SOXL — Semiconductor Bull 3X
Price: $142.26
Session Move Shown: -6.05%
BuySellBeep Bias: Flat
Sell Signal: Armed
Pivot: $150.91
S1: $147.93
S2: $144.40
S3: $141.42
SOXL finished just above S3 at $141.42.
That puts semiconductor bulls directly at an important line in the sand.
A recovery through $144.40 would be the first constructive step. Above that, $147.93 and the $150.91 pivot become the next reference points.
A loss of $141.42 would keep the short-term technical pressure intact.
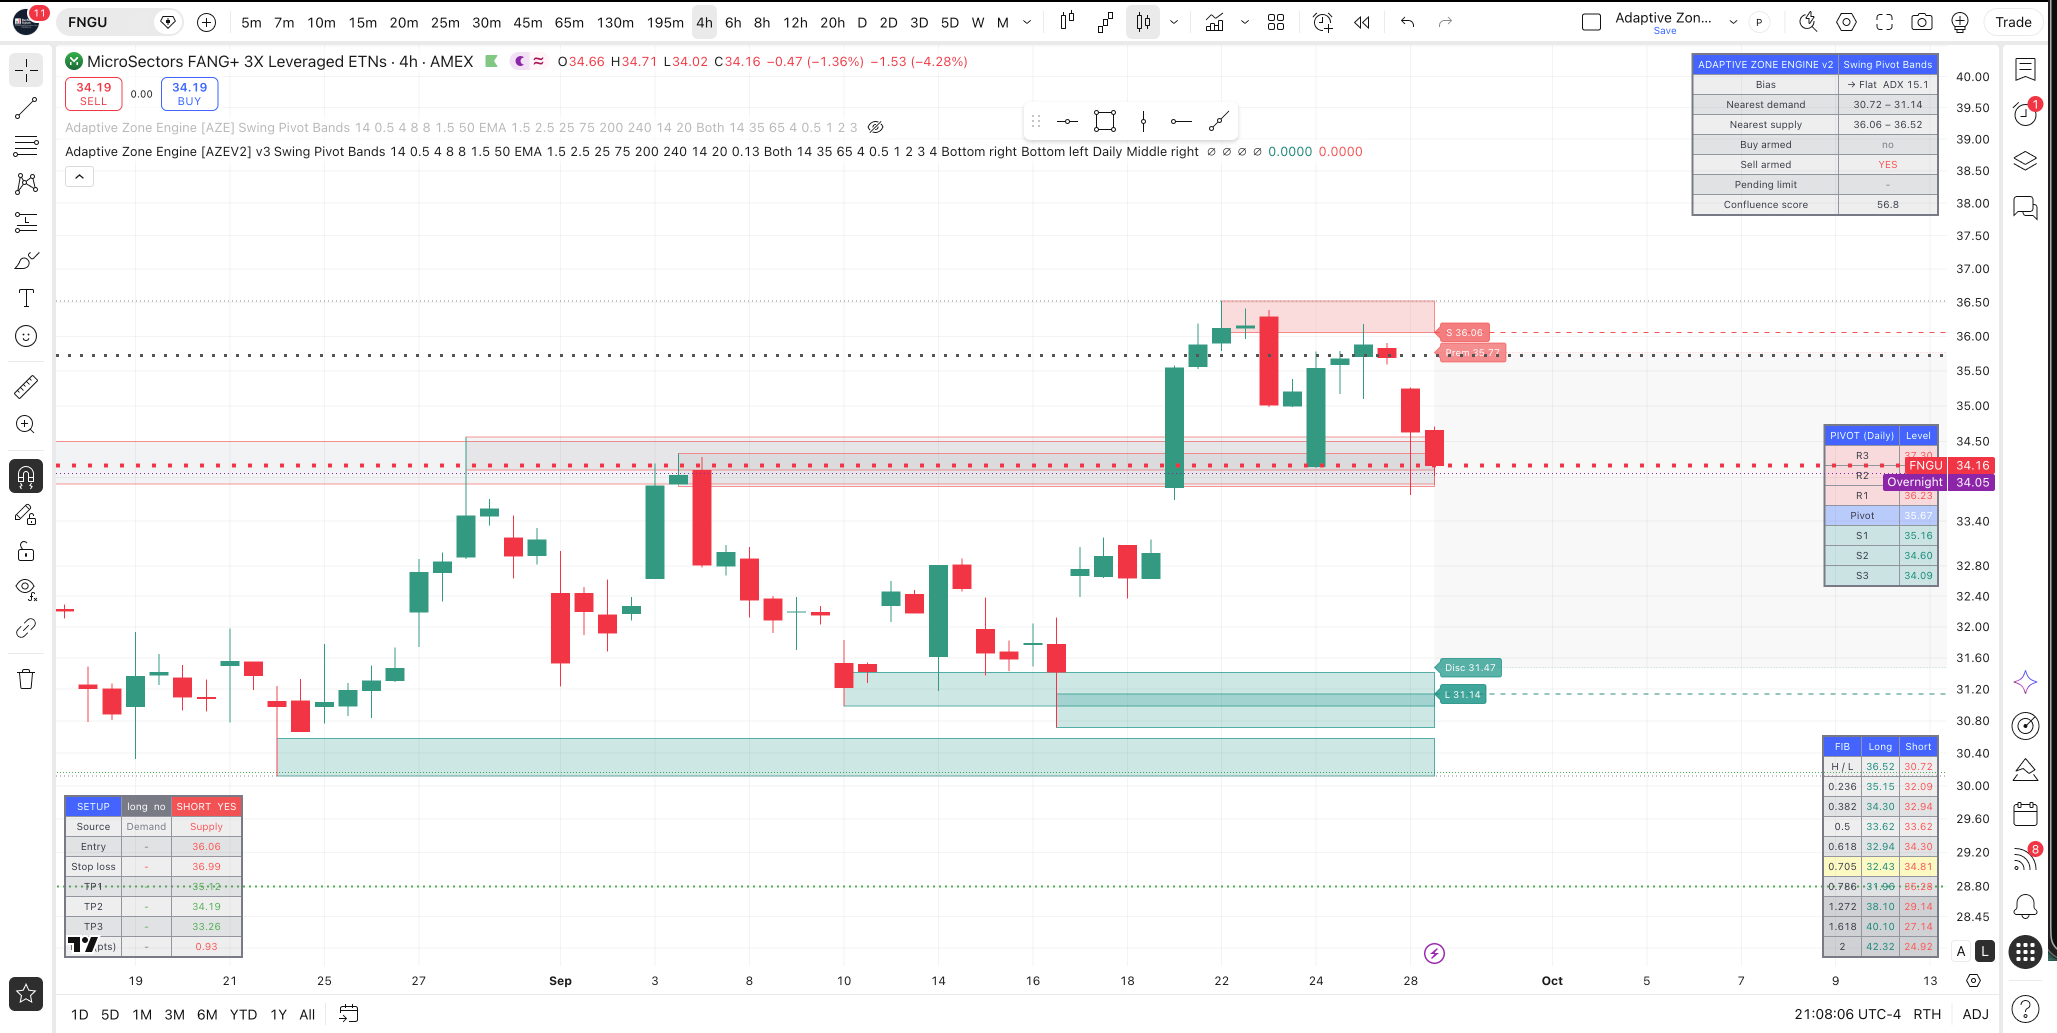
FNGU — FANG+ 3X
Price: $34.16
Session Move Shown: -4.28%
BuySellBeep Bias: Flat
Sell Signal: Armed
Pivot: approximately $35.67
S3: $34.09
Nearest Demand: $30.72–$31.14
Nearest Supply: $36.06–$36.52
FNGU closed almost exactly on S3 near $34.09 after rejecting from the $36 area.
A move back above the pivot would improve the short-term picture. Failure to hold the current support region leaves considerably more room before the next major BuySellBeep demand zone.
ETF Edge — The Message
Monday produced broad weakness across the four high-beta products we track.
TickerApprox. Session Move ShownCONL-3.65%GDXU-16.24%SOXL-6.05%FNGU-4.28%
The important part isn’t simply that they were red.
CONL, SOXL and FNGU are each approaching or sitting on meaningful support levels, while GDXU has already broken substantially beneath its daily support structure.
That gives Tuesday several clearly defined areas to monitor.
🗓️ Tuesday’s Trading Events
September 29, 2026 — Eastern Time
12:30 AM — Reserve Bank of Australia Interest Rate Decision
Forecast shown: 4.60%
Previous: 4.35%
The event occurs well before the U.S. cash session but may influence global rates, currencies and overnight risk sentiment.
10:00 AM — U.S. JOLTS Job Openings
Forecast: 7.24 million
Previous: 7.271 million
This is Tuesday’s primary scheduled U.S. release on the calendar you supplied.
JOLTS offers another look at labor-market demand. A significant surprise can affect Treasury yields and expectations around future Federal Reserve policy, which in turn can move equity index futures.
Later Tuesday Evening
9:30 PM ET — China NBS Manufacturing PMI
Forecast: 50.1
Previous: 49.8
9:45 PM ET — RatingDog Manufacturing PMI
Forecast: 51.6
Previous: 51.5
These releases arrive after the U.S. cash close but can influence overnight futures and commodities heading toward Wednesday.
👀 What We’re Watching Tuesday
The setup across markets is unusually clean.
Nasdaq: 30,370–30,449 demand is the key lower zone.
S&P 500: Watch whether 7,710–7,723 holds.
Russell 2000: Price is already testing 2,829–2,837 demand.
Gold: The market has broken beneath the entire displayed daily support ladder.
Leveraged tech: SOXL and FNGU are sitting near lower daily support while CONL is testing S1.
The market doesn’t need to be predicted.
The levels tell us where to pay attention.
Price action tells us what to do when it gets there.
🚨 You Have the Levels. Want the Signals?
Reading tomorrow’s levels is one thing.
Having the BuySellBeep system running while the market moves is another.
Try BuySellBeep Platinum for just $1 for 7 days.
Use it through a full trading week.
See the alerts.
See the zones.
See the BuySellBeep algorithm.
Then decide whether it belongs in your trading process.
→ START YOUR $1 / 7-DAY PLATINUM TRIAL
📬 Get BuySellBeep Daily
If someone forwarded you this issue, subscribe so tomorrow’s market map arrives directly to you.
Every edition includes BuySellBeep’s:
Daily futures support & resistance • Adaptive supply & demand • Algo performance • Economic events • CONL • GDXU • SOXL • FNGU
Know the levels before the market tests them.
See You Tomorrow
Know your levels.
Manage your risk.
Let price come to you.
— BuySellBeep
Risk Disclosure
Trading futures, leveraged ETFs, ETNs, options, securities, cryptocurrencies and other financial instruments involves substantial risk of loss and is not suitable for every investor. Leveraged products can magnify both gains and losses.
Any paper-brokerage, hypothetical, simulated or normalized results shown in BuySellBeep Daily have inherent limitations and should not be interpreted as actual client performance or a guarantee of future results. The $100,000 illustration above is a mathematical normalization of the percentage displayed on the supplied paper-trading dashboard and does not represent an actual $100,000 account result.
Past performance is not necessarily indicative of future results. BuySellBeep Daily is provided for informational and educational purposes and is not individualized investment advice.