BUYSELLBEEP DAILY -Daily Levels for Wednesday, September 30, 2026
BUYSELLBEEP DAILY
Daily Levels for Wednesday, September 30, 2026
Futures Levels • Economic Events • Algo Scorecard • ETF Edge
THE SETUP: NQ HOLDS ABOVE DEMAND AS A HEAVY DATA MORNING ARRIVES
Tuesday ended with major U.S. indexes near important BuySellBeep decision zones while Treasury yields remained elevated. Wednesday brings a concentrated 8:15-9:45 AM ET data window, including ADP employment, the third estimate of Q2 GDP, August personal income and spending, Core PCE, and Chicago PMI. The goal is not to predict the reaction. It is to know where price is likely to matter before the data hits.
Tomorrow in 30 Seconds
-
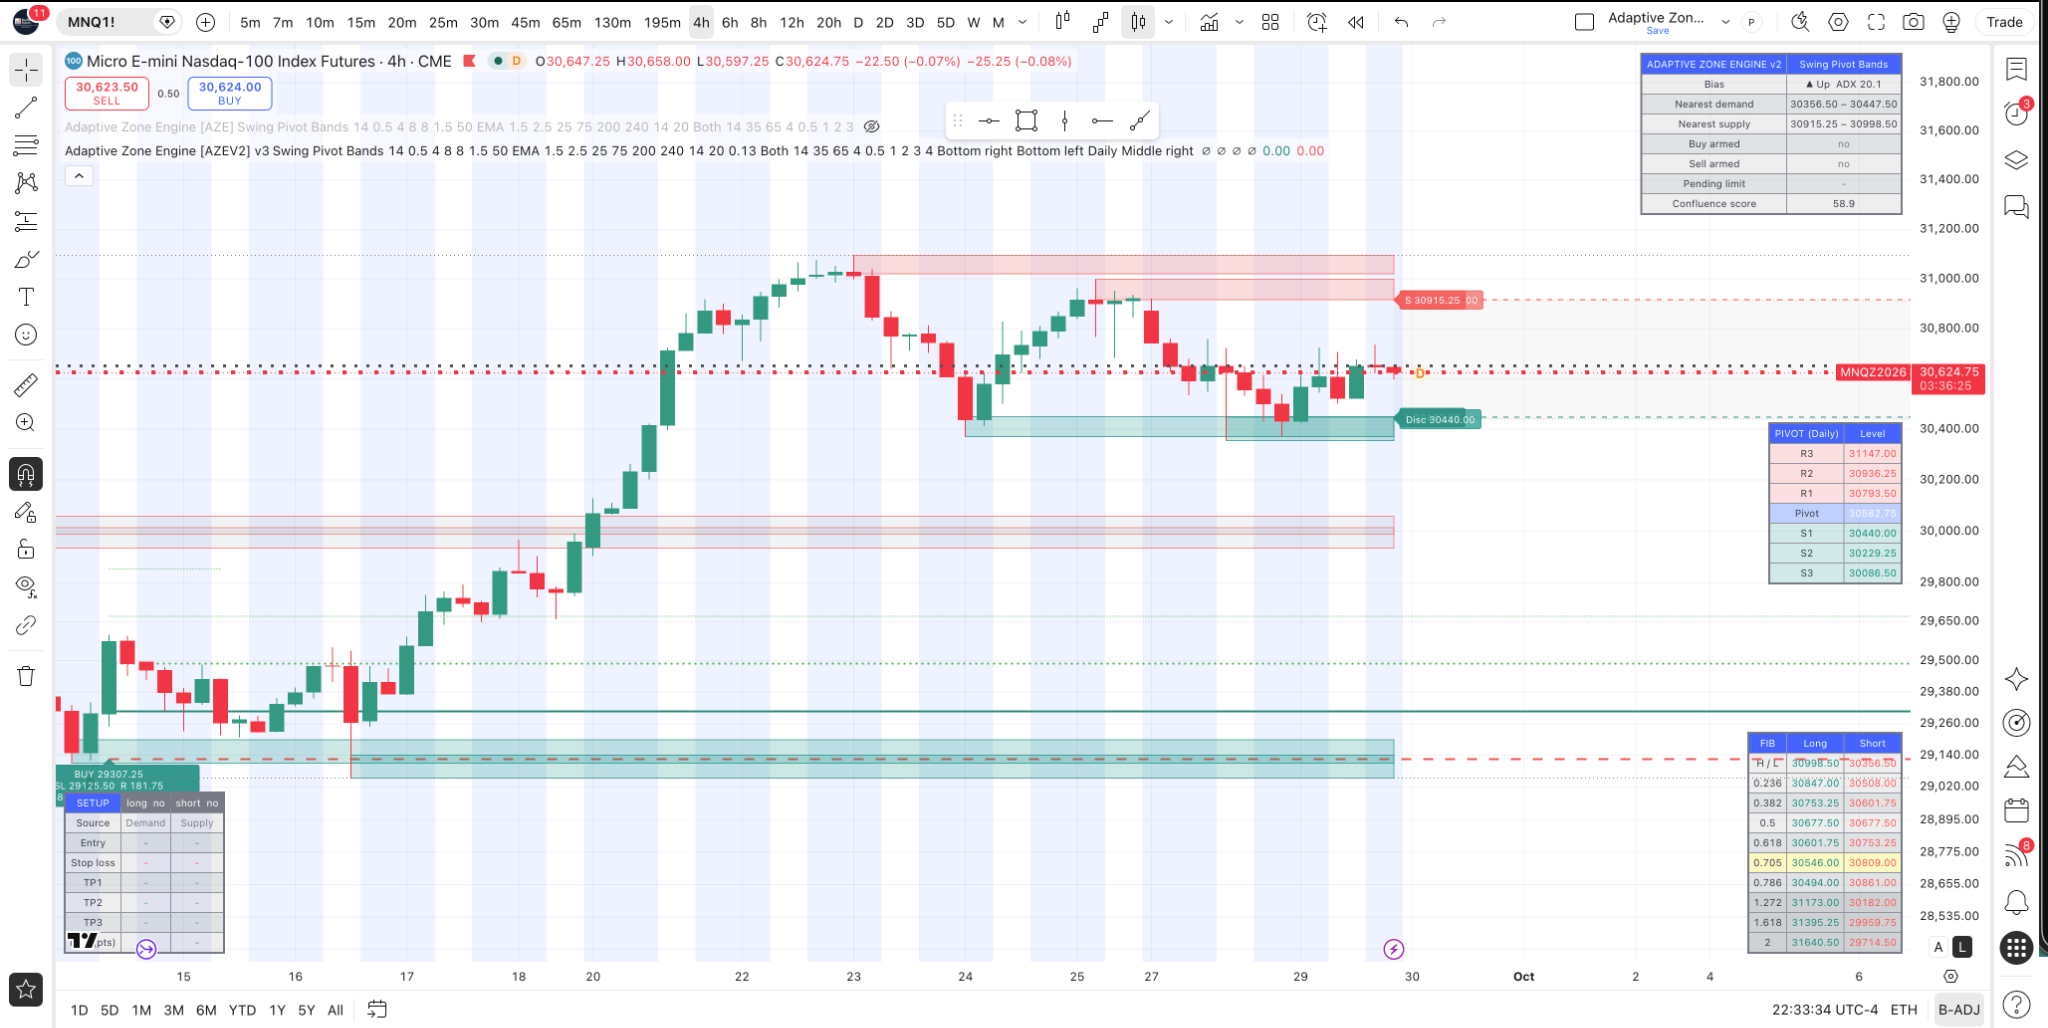
MNQ: 30,624.75 on the supplied chart; 30,356.50-30,447.50 is the nearest demand zone.
-
MES: 7,747.25; price is above the 7,739.50 pivot with BuySellBeep bias Up.
-
M2K: 2,838.1; price is sitting on/near the 2,829.8-2,837.4 demand zone.
-
MYM: 51,892; BuySellBeep shows a Flat bias with a buy condition armed.
-
8:15 AM ET: ADP Employment Change.
-
8:30 AM ET: GDP third estimate + Personal Income/Spending + PCE inflation data.
-
9:45 AM ET: Chicago PMI.
-
Algo dashboard: +0.84% return displayed; $840 mathematical equivalent on $100,000.
1. Nasdaq-100 Futures (MNQ): Primary Trading Map
Level
Price
R3
31,147.00
R2
30,936.25
R1
30,793.50
Pivot
30,582.75
S1
30,440.00
S2
30,229.25
S3
30,086.50
Nearest Demand
30,356.50-30,447.50
Nearest Supply
30,915.25-30,998.50
BuySellBeep read: Bias Up, ADX 20.1, confluence score 58.9. Price on the supplied chart is 30,624.75, above the daily pivot and above the nearest demand band. The first upside reference is 30,793.50; beyond that, the larger supply area begins near 30,915. A break back under 30,440 would place the market directly into the demand band, making 30,356.50 the key lower edge to monitor.
The clean Wednesday question: can NQ hold above the 30,582.75 pivot through the morning data, or does volatility push price back into 30,356.50-30,447.50 demand?
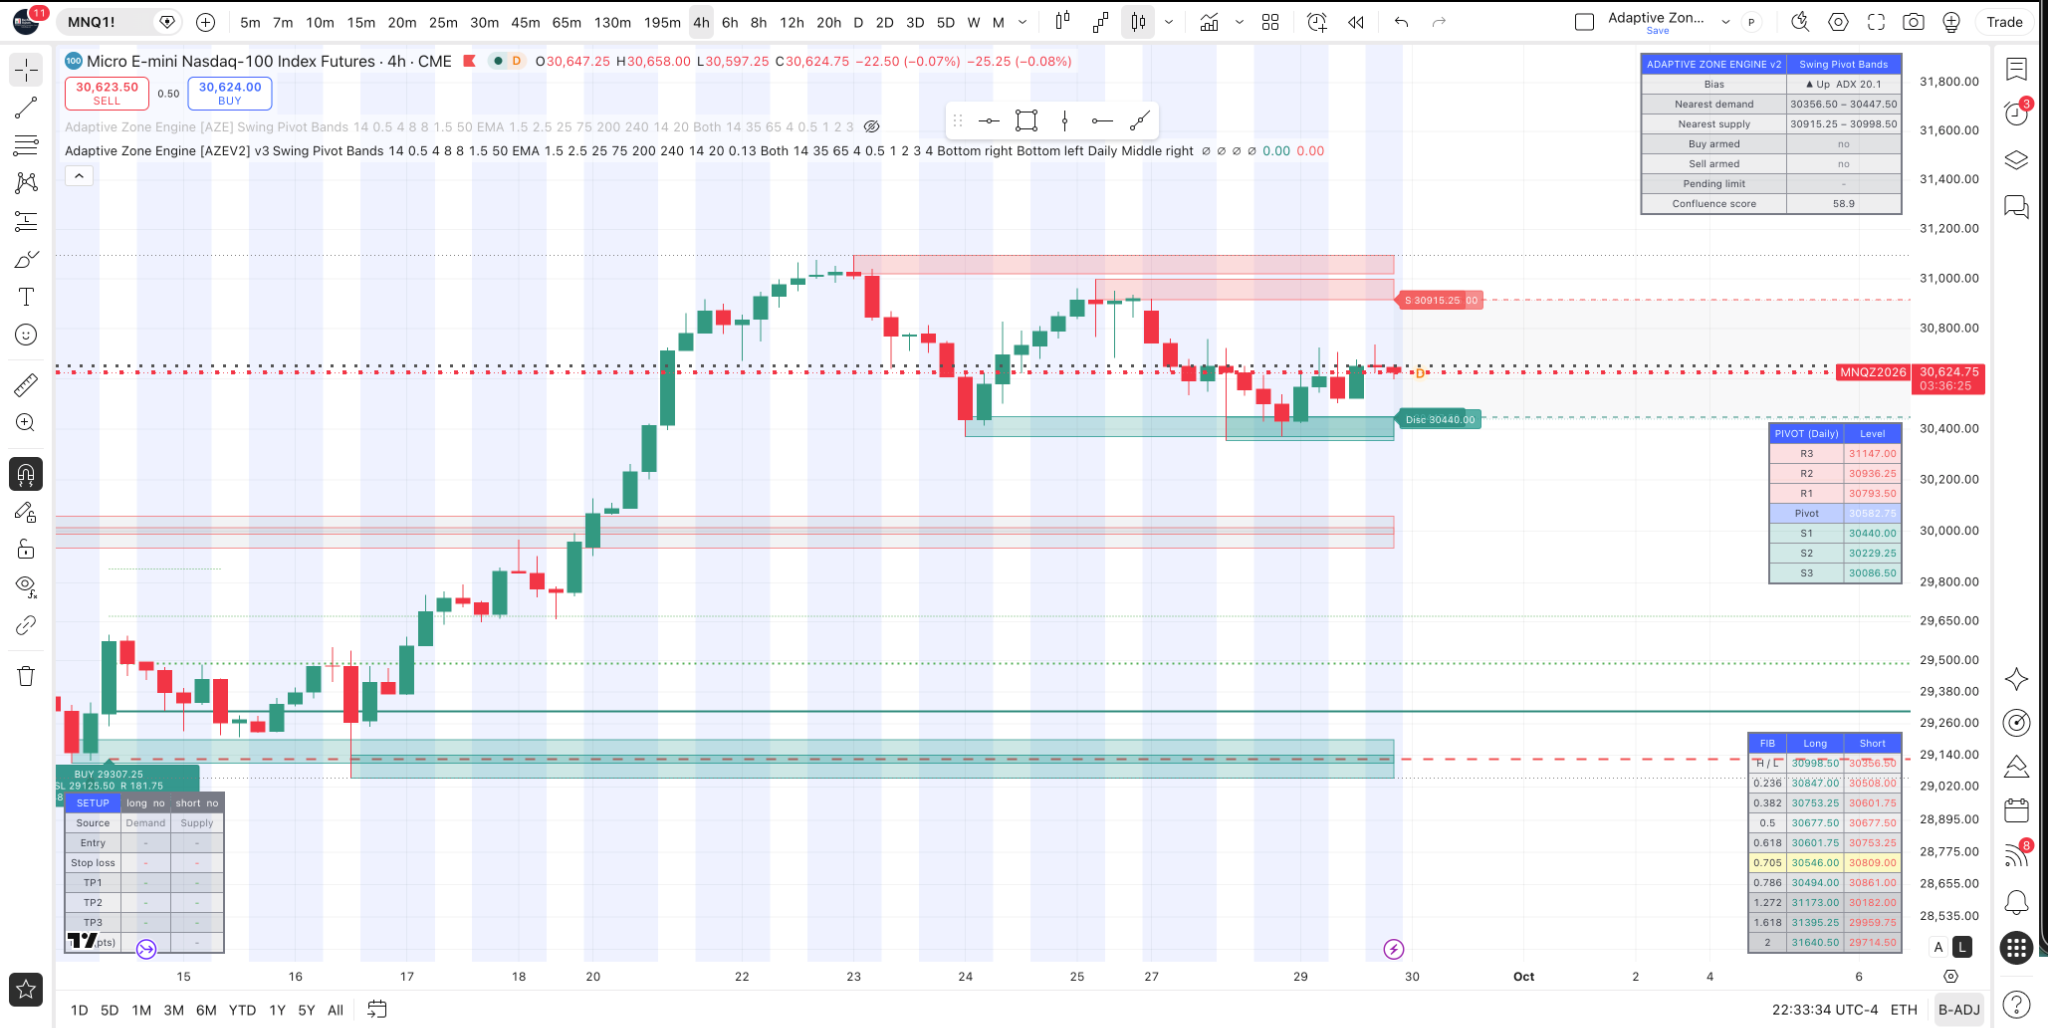
BuySellBeep MNQ 4-hour chart – supplied September 29, 2026.
2. S&P 500 Futures (MES)
Level
Price
Current chart price
7,747.25
Pivot
7,739.50
Nearest Demand
7,710.00-7,723.00
Nearest Supply
7,800.25-7,814.75
BuySellBeep Bias
Up
Confluence Score
44.2
MES is trading just above its daily pivot, with BuySellBeep showing an Up bias. The 7,710-7,723 demand band is the key downside area. Holding above the pivot keeps the 7,775-7,800 region relevant; a loss of the pivot shifts attention back toward demand.
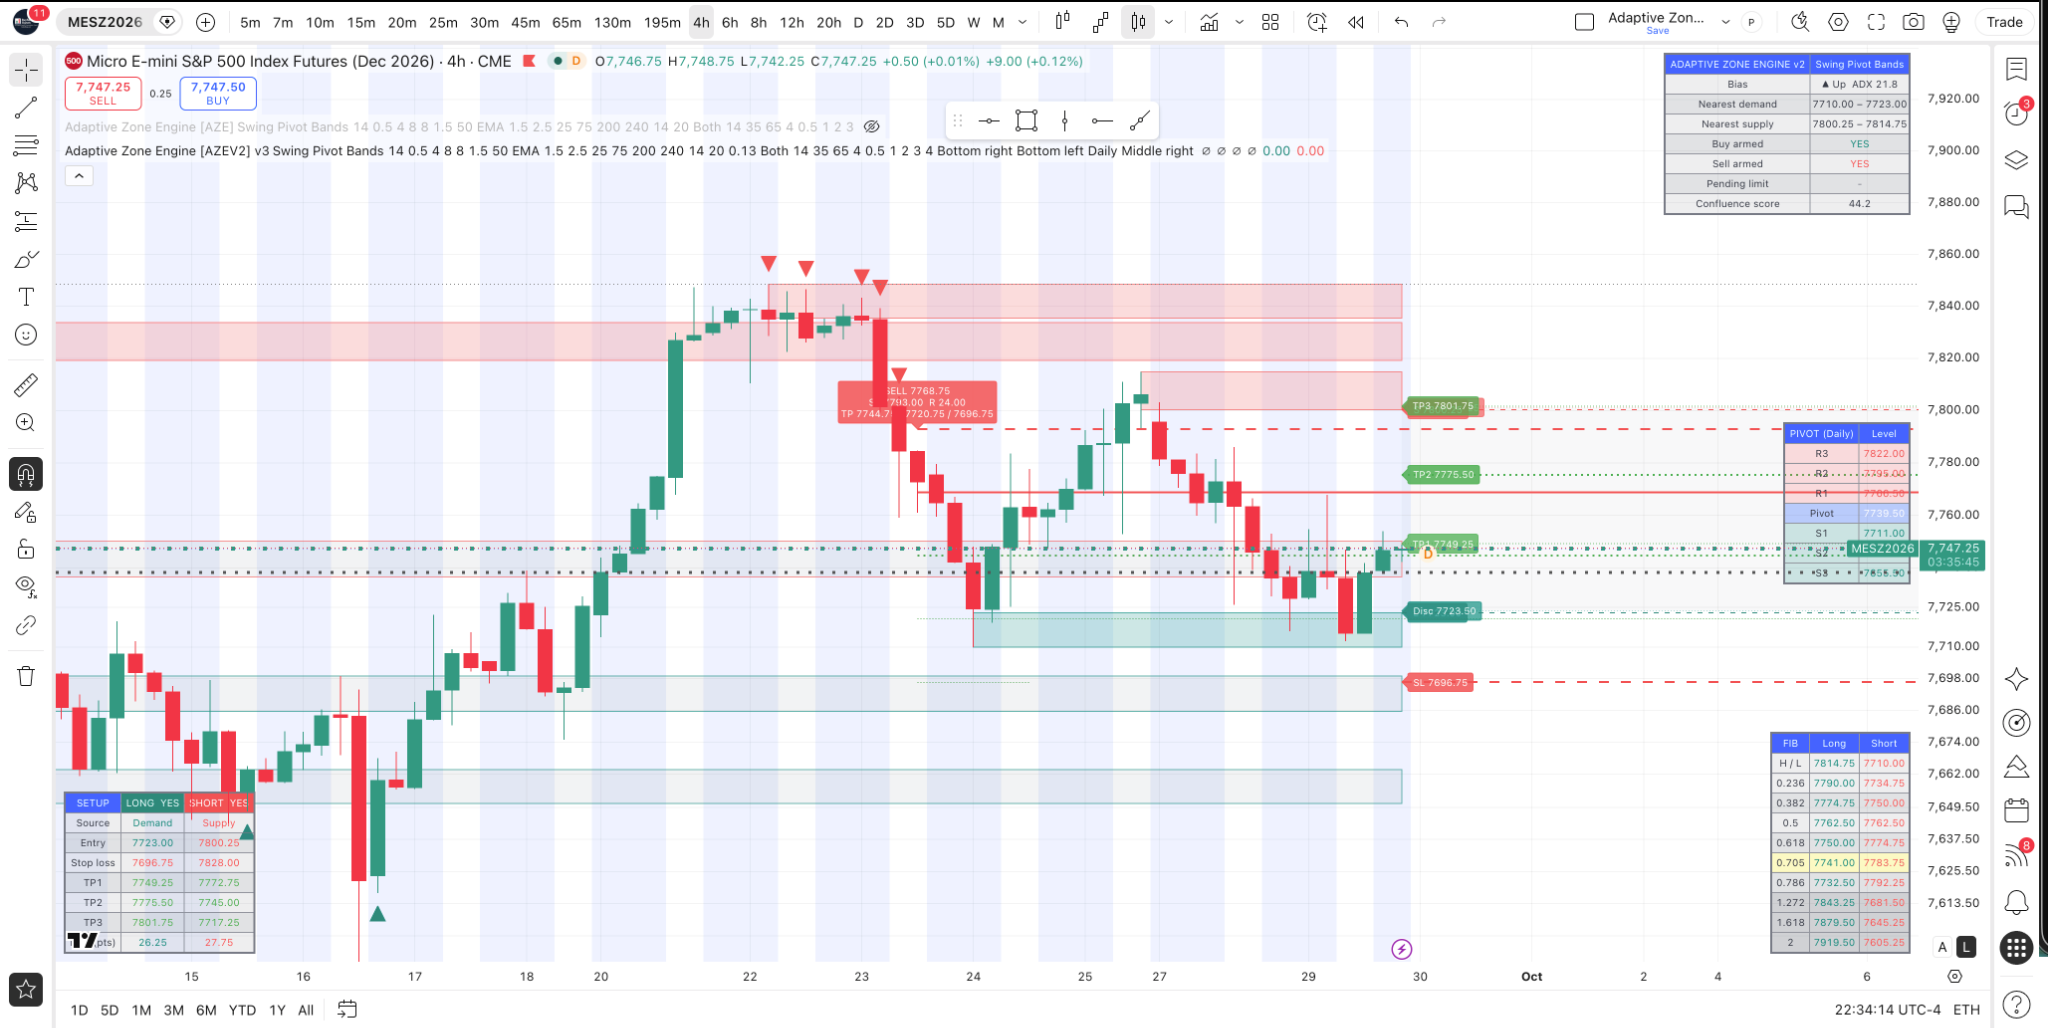
BuySellBeep MES 4-hour chart – supplied September 29, 2026.
3. Russell 2000 Futures (M2K)
Level
Price
Current chart price
2,838.1
R1
2,856.9
Pivot
2,841.8
S1
2,824.4
S2
2,809.3
S3
2,791.9
Nearest Demand
2,829.8-2,837.4
Nearest Supply
2,866.3-2,874.0
BuySellBeep shows a Down bias with ADX 37.9, while the buy condition is armed. Price is sitting at the upper edge of the nearest demand zone. That makes the Russell one of the clearest reaction tests on the board: reclaiming 2,841.8 improves the short-term structure; losing 2,829.8 exposes the lower daily supports.
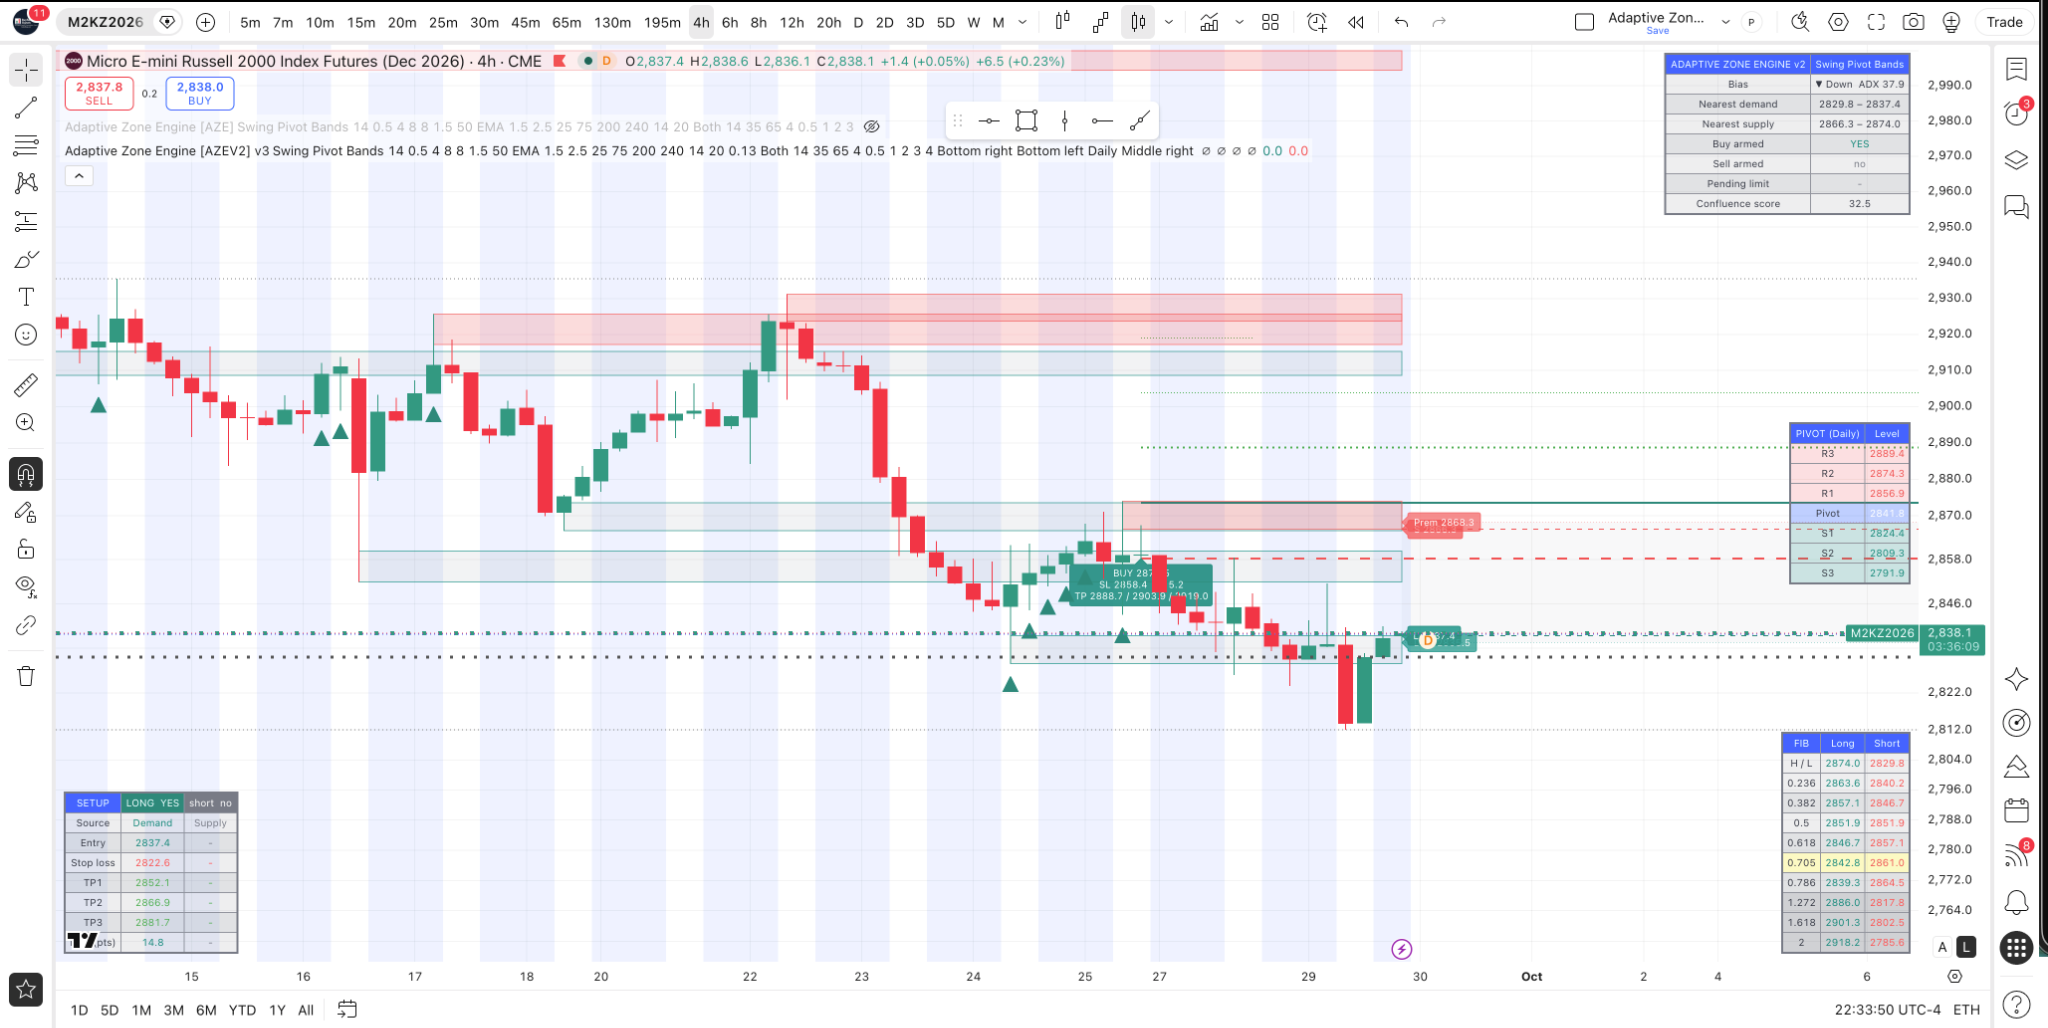
BuySellBeep M2K 4-hour chart – supplied September 29, 2026.
4. Dow Futures (MYM)
Level
Price
Current chart price
51,892
R1
52,015
Pivot
51,739
S1
51,476
S2
51,200
S3
50,937
Nearest Demand
51,478-51,591
Nearest Supply
52,112-52,223
The Dow is above its 51,739 pivot after bouncing from the lower demand structure. BuySellBeep shows a Flat bias with ADX 10.5 and the buy condition armed. The immediate upside reference is 52,015, followed by supply beginning near 52,112. A move back below 51,739 would put the 51,478-51,591 demand zone back in focus.
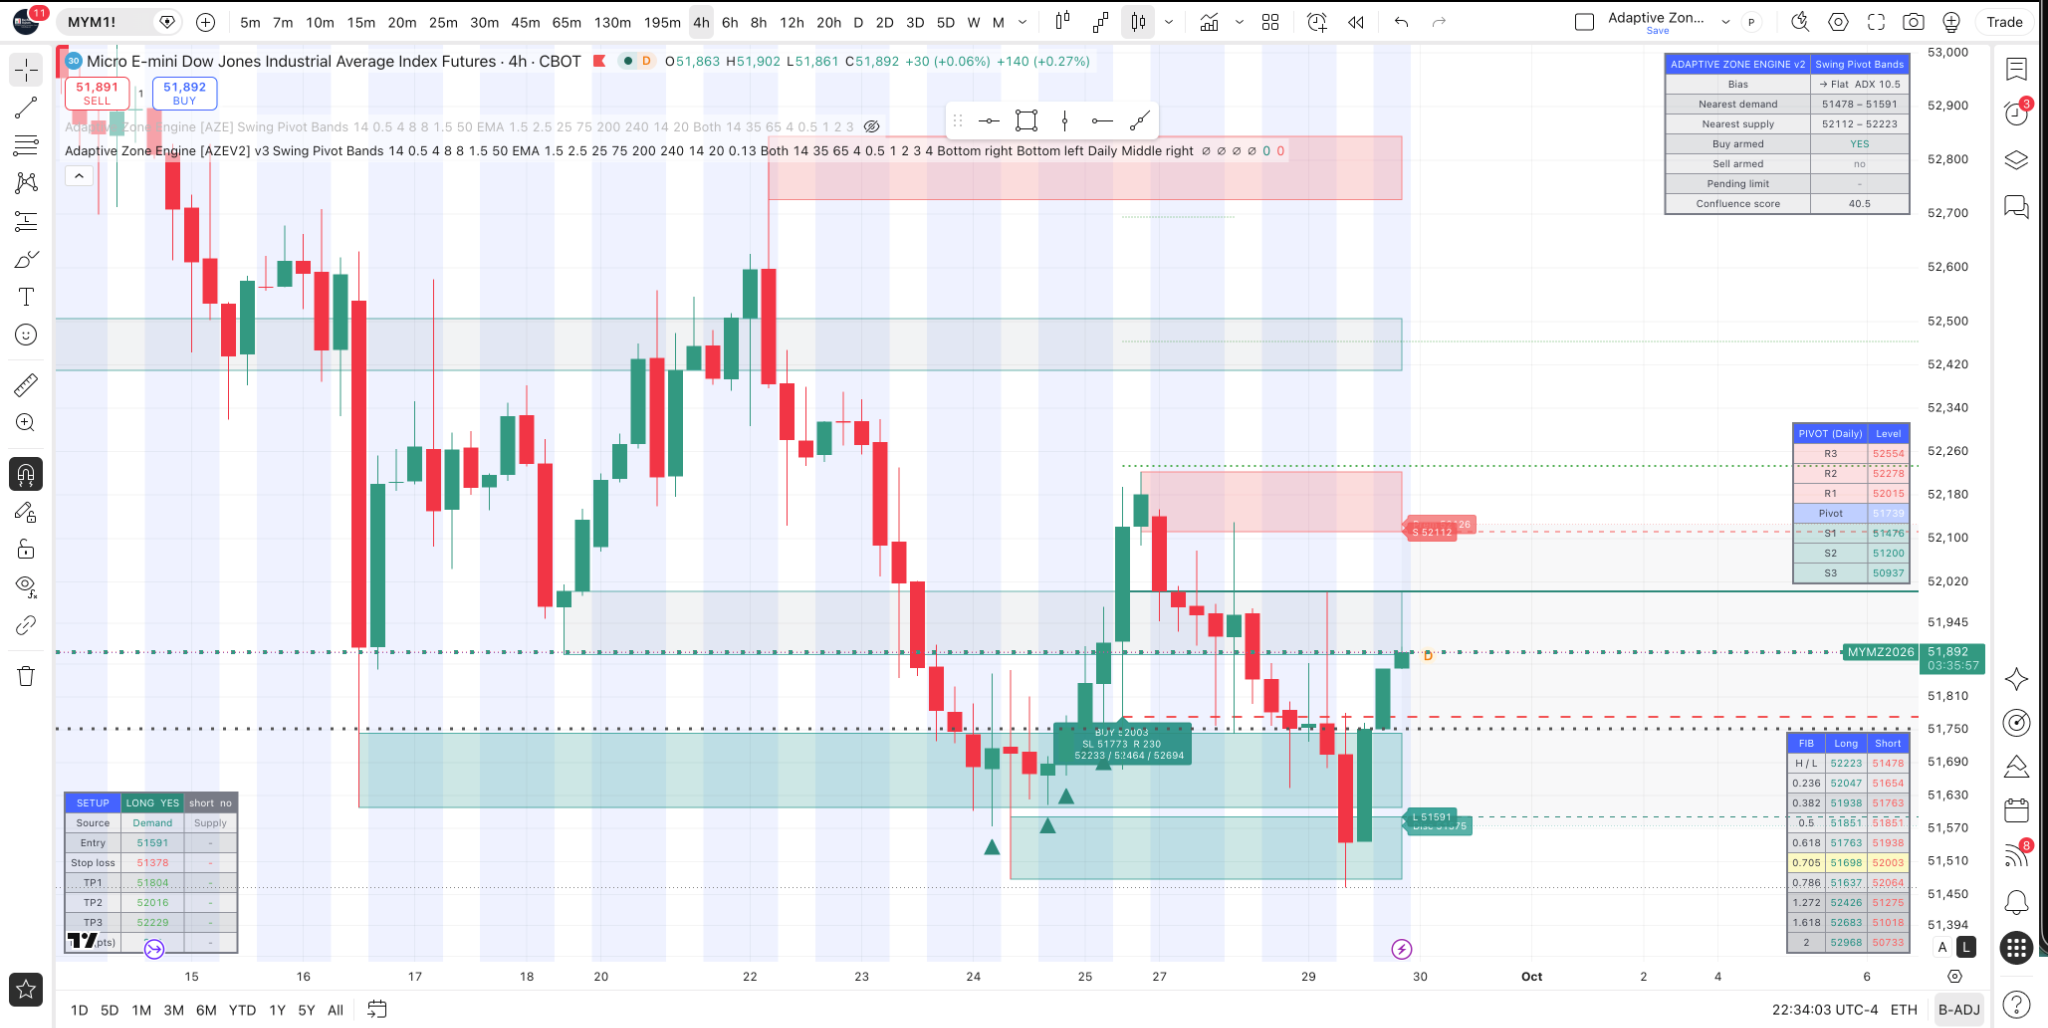
BuySellBeep MYM 4-hour chart – supplied September 29, 2026.
5. BuySellBeep Algo – Daily Scorecard
+0.84% DISPLAYED RETURN = +$840 ON A HYPOTHETICAL $100,000
Paper Brokerage Dashboard
Displayed Value
Equity
$100,837.20
Return
+0.84%
Net Profit
-$347.10
Unrealized
+$1,184.30
Fees
-$17.10
Holdings
$612,145.00
Volume
$1,839,250.00
$100K mathematical equivalent
+$840
Important: the dashboard simultaneously shows a negative realized net profit and a positive unrealized P/L. The +0.84% figure is the return displayed by the paper-brokerage dashboard. The $840 figure is only a standardized mathematical illustration of 0.84% on $100,000; it is not a statement that an actual $100,000 account earned $840.

Paper-brokerage performance dashboard supplied for this issue.
6. ETF EDGE – Four High-Beta Markets
The daily-move figures below are the percentage moves displayed on the supplied charts. These products use leveraged daily exposure, so their behavior can differ sharply from the underlying asset over multi-day holding periods.
CONL – GraniteShares 2x Long COIN
Metric
Value
Chart price
$5.98
Displayed daily move
-1.64%
Pivot
$6.22
S1
$5.91
S2
$5.73
S3
$5.42
Nearest Supply
$6.91-$7.18
CONL is below the $6.22 pivot and trading near first support. A recovery above $6.22 would improve the short-term picture; failure to hold the $5.91 area keeps lower supports in view.
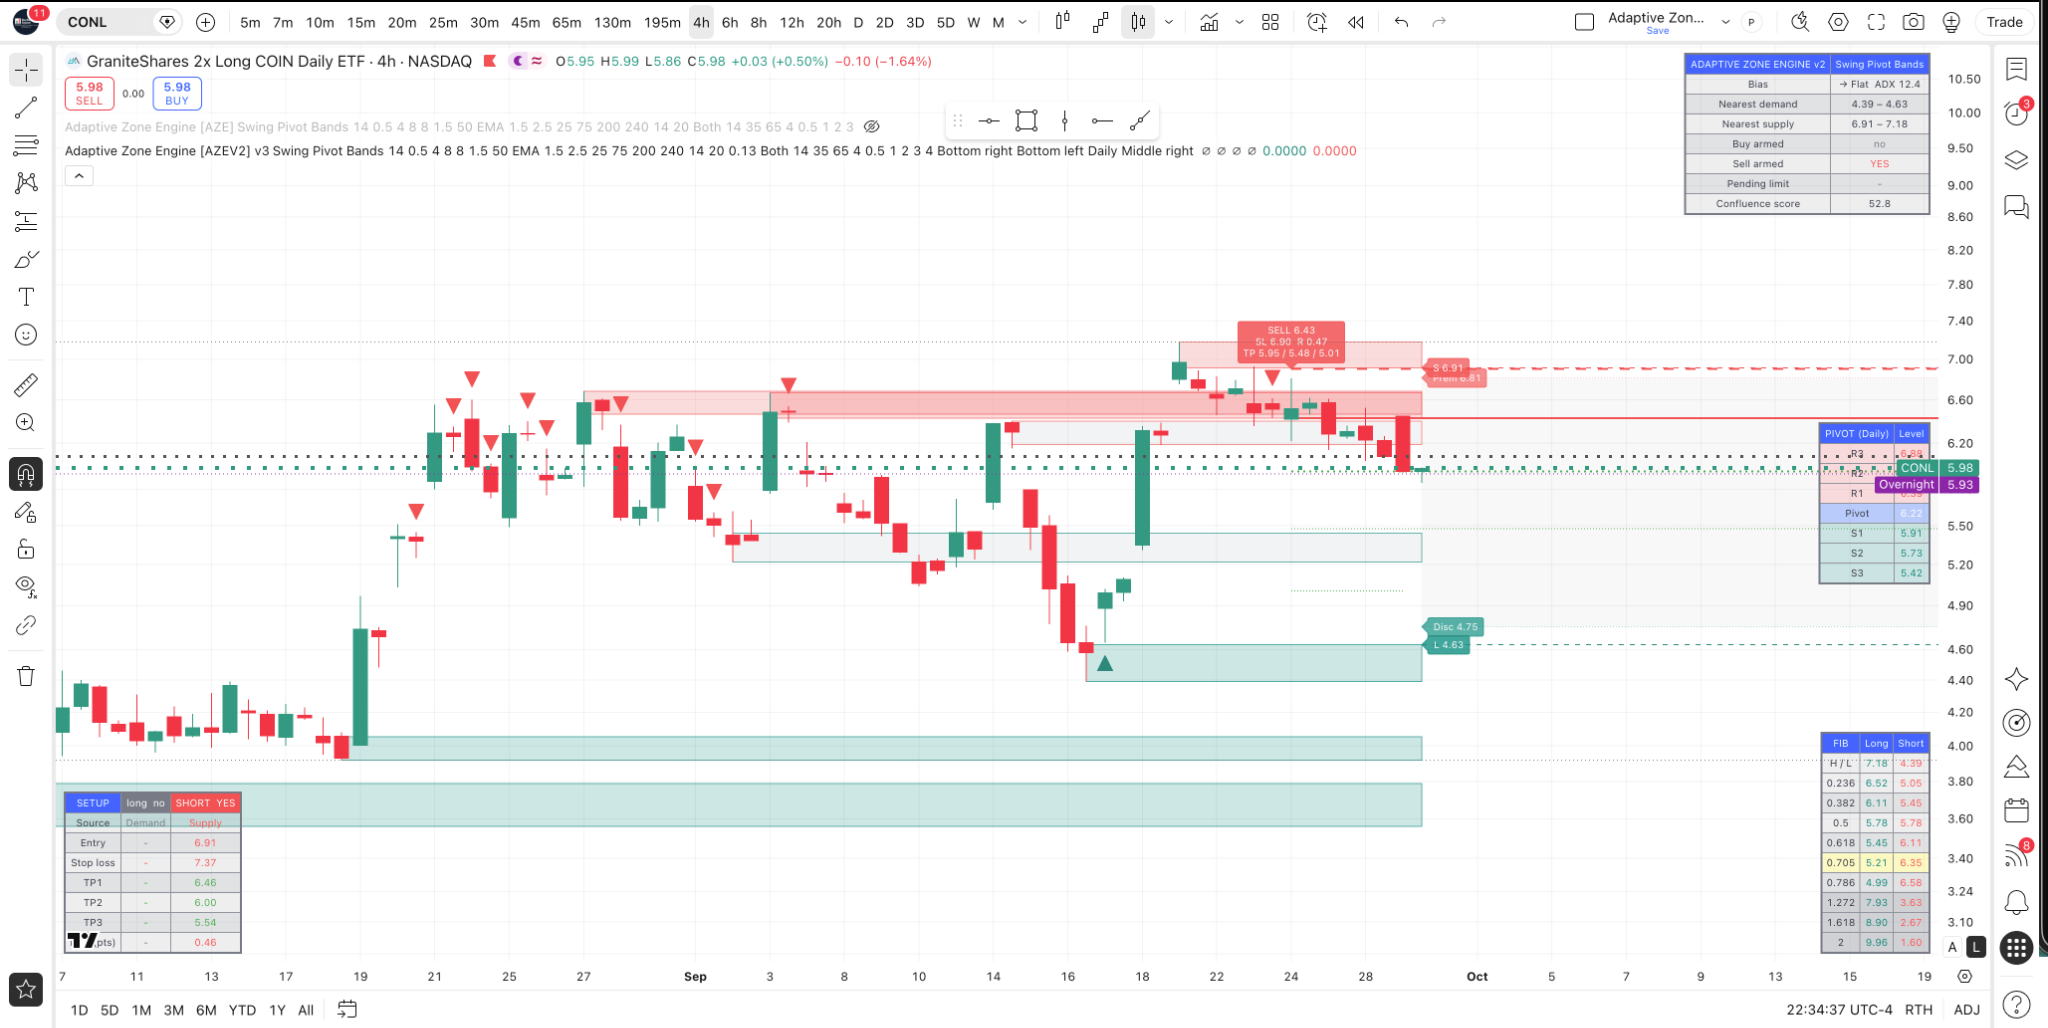
CONL – GraniteShares 2x Long COIN – supplied chart.
GDXU – MicroSectors Gold Miners 3x Leveraged ETN
Metric
Value
Chart price
$111.00
Displayed daily move
+3.72%
Pivot
$108.51
R1
$111.99
R2
$116.98
R3
$120.46
Nearest Demand
$121.40-$126.65
GDXU bounced sharply on the supplied chart and is back above its daily pivot. The first overhead reference is roughly $112, followed by $116.98. Because price remains below the larger 121.40-126.65 zone, the rebound still faces substantial overhead structure.
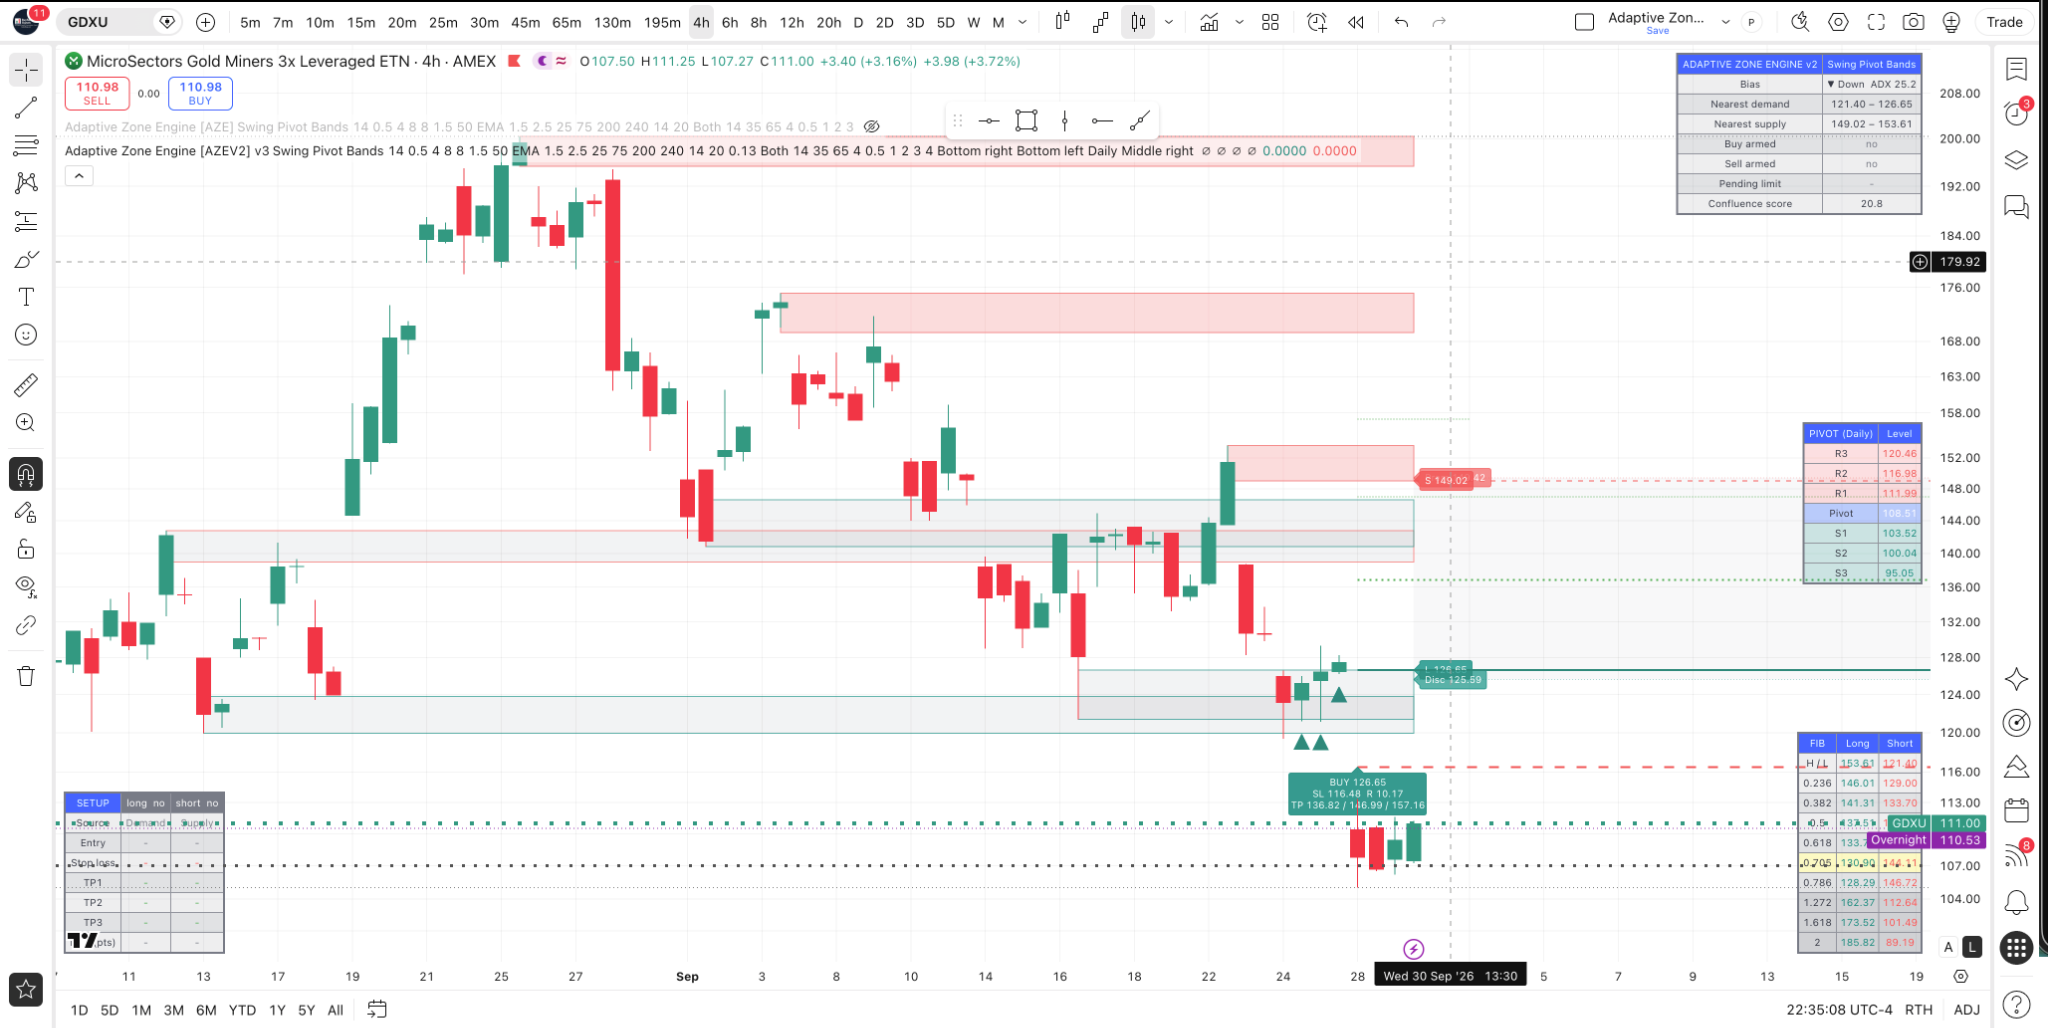
GDXU – MicroSectors Gold Miners 3x Leveraged ETN – supplied chart.
SOXL – Direxion Daily Semiconductor Bull 3X
Metric
Value
Chart price
$147.04
Displayed daily move
+3.31%
Pivot
$142.50
R1
$149.78
R2
$157.28
R3
$164.56
Pending limit shown
$151.66
SOXL rebounded and is above its daily pivot. The next technical test is around $149.78-$151.66. A clean hold above that area would bring higher resistance into play; rejection would put $142.50 back on the radar.
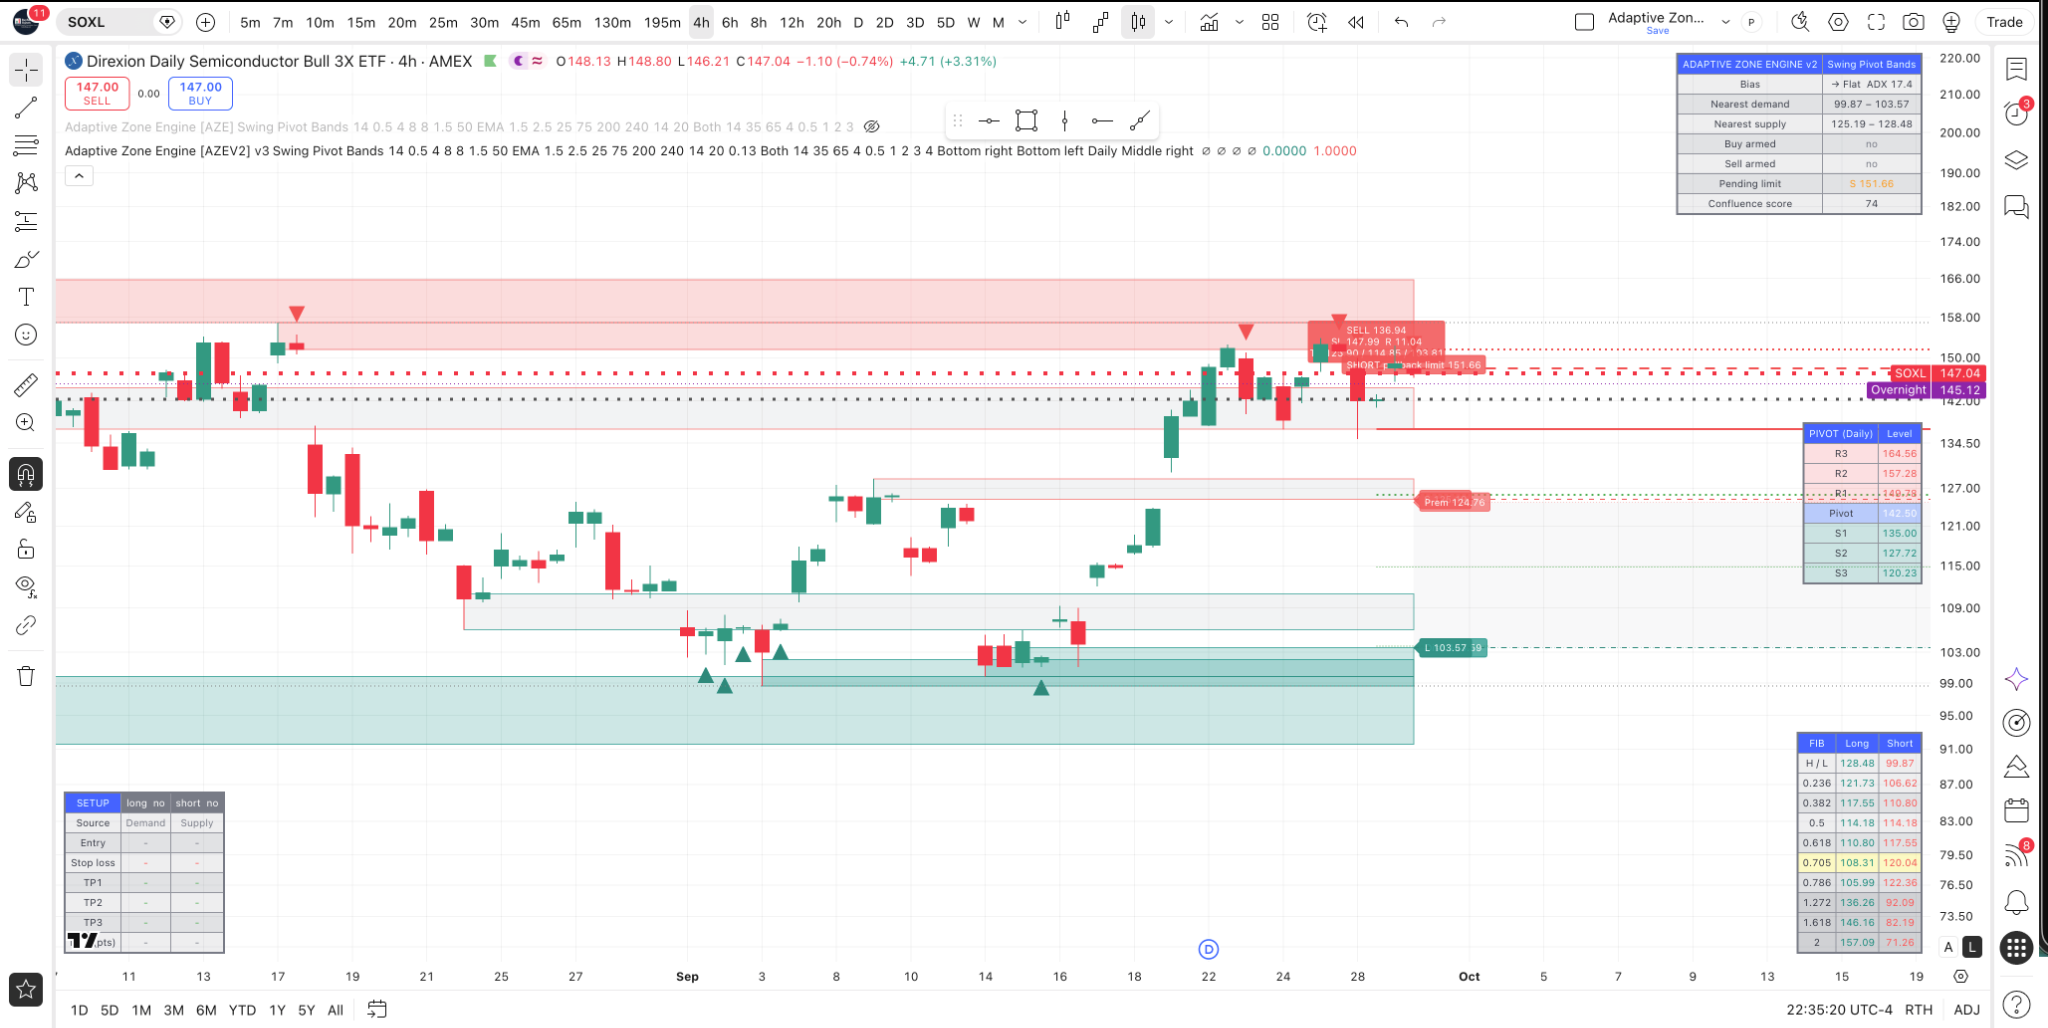
SOXL – Direxion Daily Semiconductor Bull 3X – supplied chart.
FNGU – MicroSectors FANG+ 3X Leveraged ETN
Metric
Value
Chart price
$34.44
Displayed daily move
+0.88%
Pivot
$34.40
R1
$35.04
R2
$35.89
R3
$36.53
Nearest Supply
$36.06-$36.52
FNGU is almost exactly on its $34.40 pivot. That makes the pivot the immediate decision point. Above it, $35.04 and then the $36.06-$36.52 supply zone matter; below it, the lower support ladder becomes relevant.
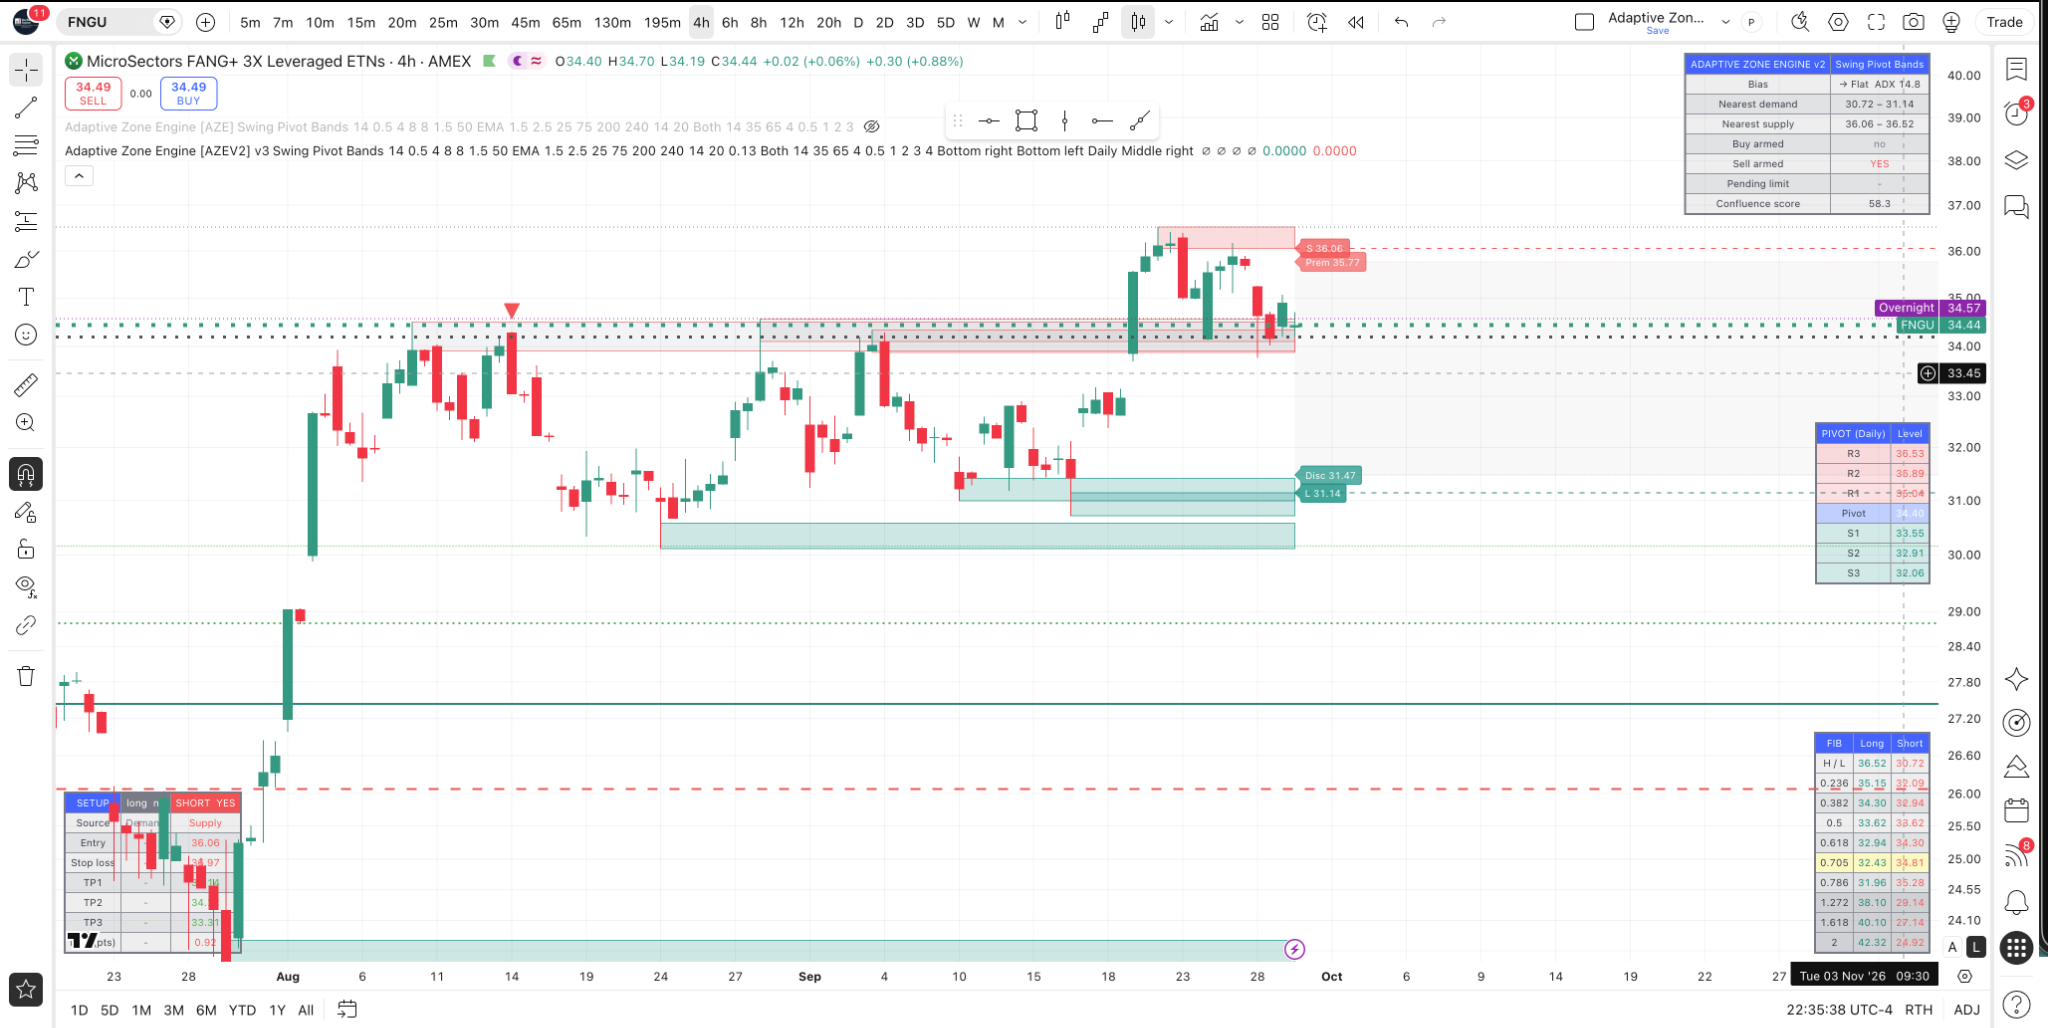
FNGU – MicroSectors FANG+ 3X Leveraged ETN – supplied chart.
7. Wednesday Economic Events – September 30
Time (ET)
Event
8:15 AM
ADP Employment Change
8:30 AM
GDP, Q2 Third Estimate
8:30 AM
Core PCE Price Index / PCE inflation
8:30 AM
Personal Income
8:30 AM
Personal Spending
9:45 AM
Chicago PMI
7:50 PM
Japan Tankan Large Manufacturers Index
9:30 PM
Australia Balance of Trade
The highest-risk window for U.S. index futures is 8:15-9:45 AM ET. ADP arrives first, followed fifteen minutes later by a dense 8:30 release block. The Bureau of Economic Analysis schedule confirms both the Q2 GDP third estimate and August Personal Income and Outlays for 8:30 AM ET on September 30. That clustering can create fast repricing in Treasury yields and equity-index futures.
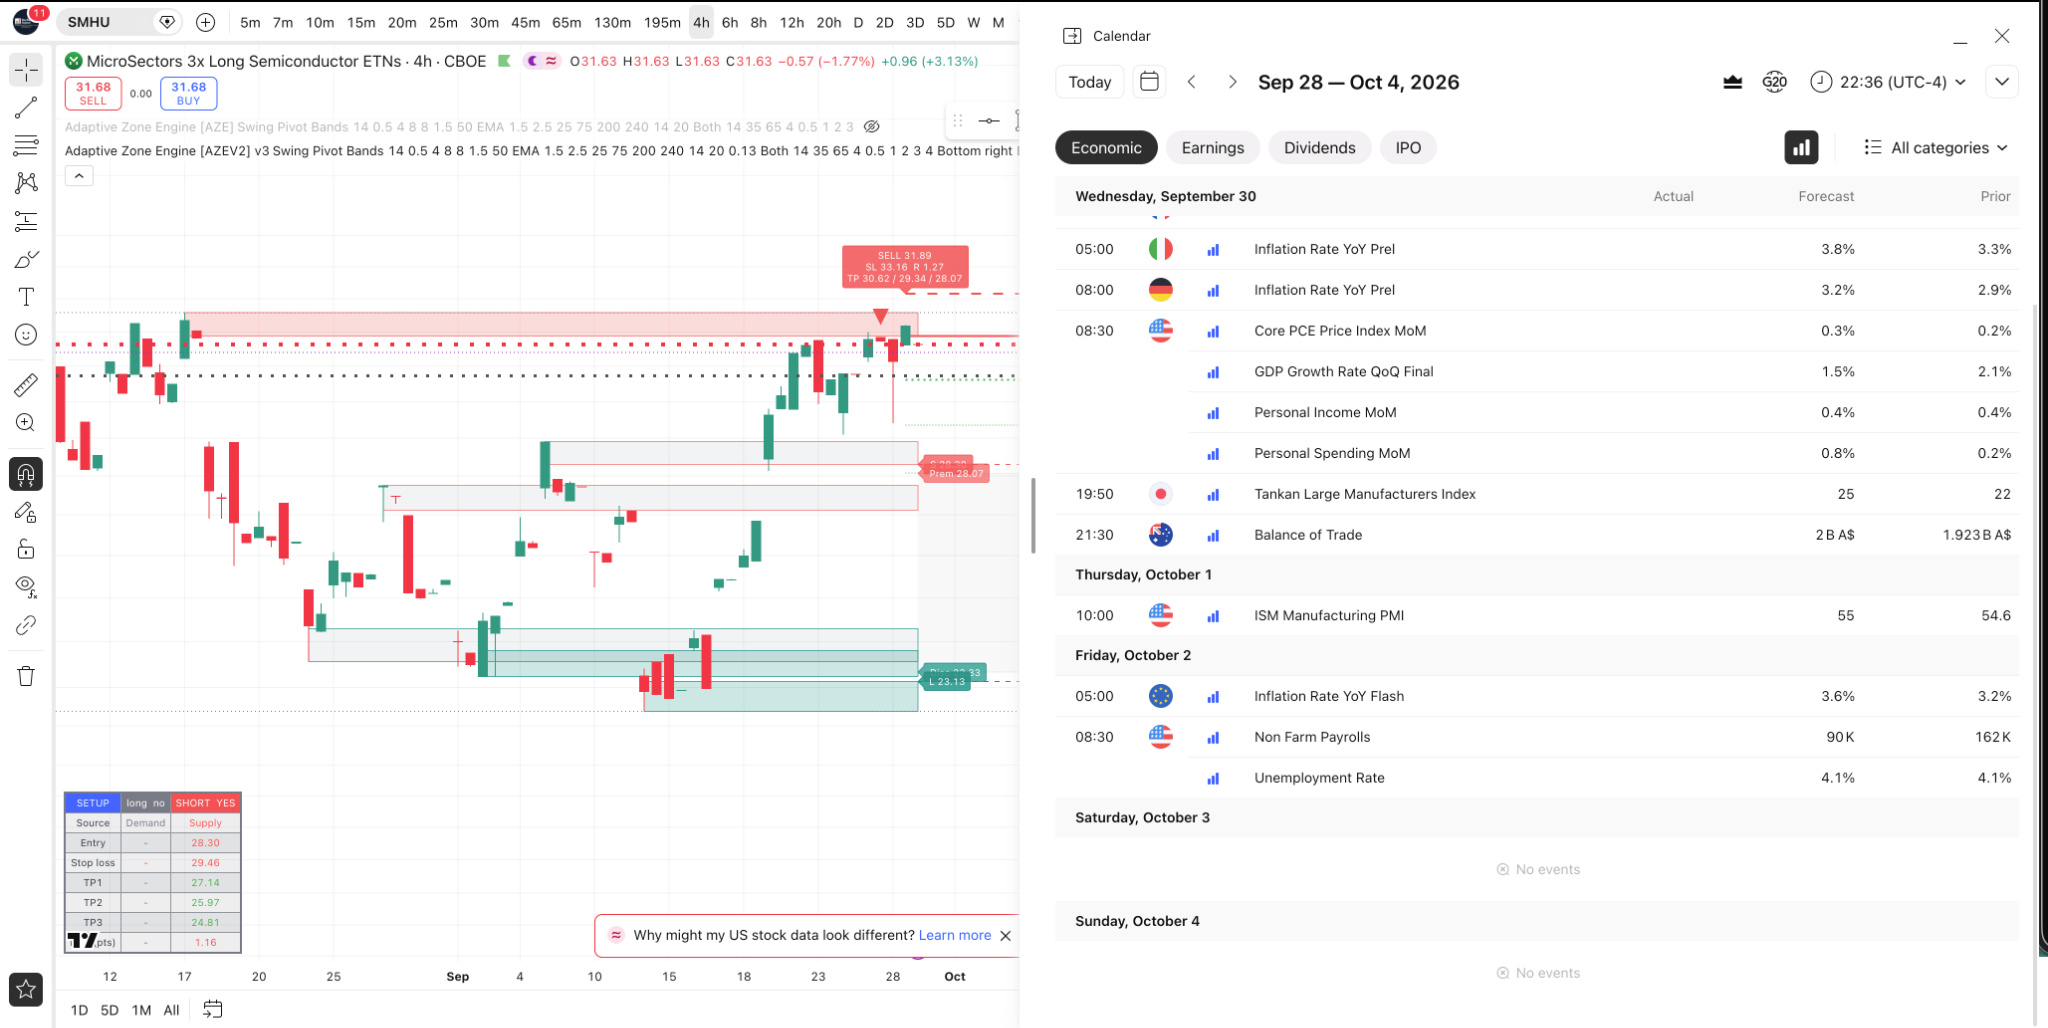
Economic calendar supplied for September 30, 2026.
8. Market Context Going Into Wednesday
U.S. equities finished Tuesday slightly lower as Treasury yields remained near multi-year highs and investors waited for the next round of inflation, growth, and labor-market data. That backdrop makes Wednesday’s early-morning releases especially relevant for NQ and other duration-sensitive growth trades.
For traders, the practical takeaway is simple: expect the most important information to come from the interaction between the data reaction and the levels already on the chart. A headline can create the impulse; the support, pivot, and supply zones help define whether that impulse is being accepted or rejected.
You Have the Levels. Now Get the Signals.
TRY BUYSELLBEEP PLATINUM FOR $1 FOR 7 DAYS
Use BuySellBeep through a full trading week and see the adaptive zones, algorithm signals, alerts, and member tools in real time. The newsletter gives you the map; Platinum is designed to put the full BuySellBeep workflow in front of you while the market is moving.
Platinum: https://buysellbeep.com/product/platinum-plan/
Get BuySellBeep Daily
If this issue was forwarded to you, subscribe so the next trading-day map lands in your inbox. Each edition is built around futures support and resistance, BuySellBeep adaptive supply/demand zones, the daily algo scorecard, the economic calendar, and ETF Edge coverage of CONL, GDXU, SOXL and FNGU.
Know the levels. Manage the risk. Let price come to you.
– BuySellBeep
Risk & Performance Disclosure
Trading futures, leveraged ETFs/ETNs, options, securities, cryptocurrencies and other financial instruments involves substantial risk of loss and is not suitable for every investor. Leverage can magnify both gains and losses. Paper, simulated, hypothetical and normalized performance has inherent limitations and may differ materially from live results. Past performance is not necessarily indicative of future results. The $100,000 illustration in this issue is a mathematical normalization of the percentage displayed on the supplied paper-trading dashboard and is not an actual $100,000 account result. BuySellBeep Daily is provided for informational and educational purposes and is not individualized investment advice.
Sources for the Event/Market Context
U.S. Bureau of Economic Analysis release schedule (September 30, 2026); TradingCharts U.S. economic calendar for September 30, 2026; Reuters market report dated September 29, 2026. All technical levels, dashboard readings and chart percentages above are taken from the screenshots supplied for this issue.